Bilješka
Pristup ovoj stranici zahtijeva provjeru vjerodostojnosti. Možete pokušati da se prijavite ili promijenite direktorije.
Pristup ovoj stranici zahtijeva provjeru vjerodostojnosti. Možete pokušati promijeniti direktorije.
Applies to:  SQL Server 2019 and earlier Analysis Services
  Azure Analysis Services
Fabric/Power BI Premium
Azure Analysis Services
Fabric/Power BI Premium
Important
Data mining was deprecated in SQL Server 2017 Analysis Services and now discontinued in SQL Server 2022 Analysis Services. Documentation is not updated for deprecated and discontinued features. To learn more, see Analysis Services backward compatibility.
The Microsoft Decision Trees Algorithm is a classification and regression algorithm for use in predictive modeling of both discrete and continuous attributes.
For discrete attributes, the algorithm makes predictions based on the relationships between input columns in a dataset. The algorithm uses the values or states of those columns to predict the states of a column that you designate as predictable. Specifically, the algorithm identifies the input columns that are correlated with the predictable column.
For example, in a scenario to predict which customers are likely to purchase a bicycle, if nine out of ten younger customers but only two out of ten older customers buy a bicycle, the algorithm infers that age is a good predictor of bicycle purchase. The decision tree makes predictions based on this tendency toward a particular outcome.
For continuous attributes, the algorithm uses linear regression to determine where a decision tree splits.
If more than one column is set to predictable, or if the input data contains a nested table that is set to predictable, the algorithm builds a separate decision tree for each predictable column.
Example
The marketing department of the Adventure Works Cycles company wants to identify the characteristics of previous customers that might indicate whether those customers are likely to buy a product in the future. The AdventureWorks2012 database stores demographic information that describes previous customers. By using the Microsoft Decision Trees Algorithm to analyze this information, the marketing department can build a model that predicts whether a particular customer will purchase products, based on the states of known columns about that customer, such as demographics or past buying patterns.
How the algorithm works
The Microsoft Decision Trees Algorithm builds a data mining model by creating a series of splits in the tree. These splits are represented as nodes. The algorithm adds a node to the model every time it finds an input column that's significantly correlated with the predictable column. The way that the algorithm determines a split is different depending on whether it is predicting a continuous column or a discrete column.
The Microsoft Decision Trees Algorithm uses feature selection to guide the selection of the most useful attributes. All SQL Server data mining algorithms use feature selection to improve performance and analysis quality and prevent unimportant attributes from using processor time. If you use too many input or predictable attributes when you design a data mining model, the model can take a long time to process or run out of memory. Methods used to determine whether to split the tree include industry-standard metrics for entropy and Bayesian networks. For more information about the methods used to select meaningful attributes and then score and rank the attributes, see Feature Selection (Data Mining).
A common problem in data mining models is the model becoming too sensitive to small differences in the training data, which is called being overfitted or overtrained. An overfitted model can't be generalized to other data sets. To avoid overfitting on a particular set of data, the Microsoft Decision Trees Algorithm uses techniques for controlling the growth of the tree. For an in-depth explanation of how the Microsoft Decision Trees Algorithm works, see Microsoft Decision Trees Algorithm Technical Reference.
Predicting discrete columns
The Microsoft Decision Trees Algorithm builds a tree for a discrete predictable column by using a histogram. The following diagram shows a histogram that plots a predictable column, Bike Buyers, against an input column, Age. The histogram shows that the age of a person helps distinguish whether that person purchases a bicycle.
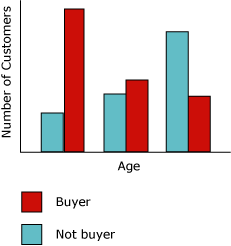
The correlation shown in the diagram causes the Microsoft Decision Trees Algorithm to create a new node in the model.
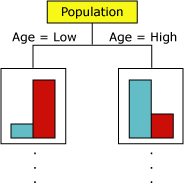
As the algorithm adds new nodes to a model, it creates a tree structure. The top node of the tree describes the breakdown of the predictable column for the overall population of customers. As the model continues to grow, the algorithm considers all columns.
Predicting continuous columns
When the Microsoft Decision Trees Algorithm builds a tree based on a continuous predictable column, each node contains a regression formula. A split occurs at a point of nonlinearity in the regression formula. For example, consider the following diagram.
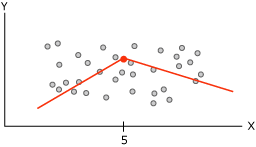
A standard regression model attempts to derive a single formula that represents the trend and relationships for the data as a whole. However, a single formula might do a poor job of capturing the discontinuity in complex data. Instead, the Microsoft Decision Trees Algorithm looks for segments of the tree that are largely linear, and creates separate formulas for these segments. By breaking up the data into different segments, the model can do a better job of approximating the data.
The following diagram represents the tree diagram for the model in the preceding scatterplot. To predict the outcome, the model provides two different formulas: one for the left branch with the formula y = .5x x 5, and one for the right branch with the formula y = .25x + 8.75. The point where the two lines come together in the scatterplot is the point of nonlinearity where a node in a decision tree model splits.
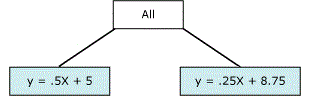
This model is simple with only two linear equations, so the split in the tree is immediately after the All node. However, a split can occur at any level of the tree. In a tree containing multiple levels and nodes where each node is characterized by a different collection of attributes, a formula might be shared across multiple nodes or apply only to a single node.
For example, you might get one formula for a node defined as "customers over a certain age and income" and another in a node that represents "customers who commute long distances." To see the formula for an individual node or segment, select the node.
Data required for decision tree models
When you prepare data for use in a decision tree model, understand the requirements for the particular algorithm, including how much data it needs and how it uses the data.
The requirements for a decision tree model are as follows:
A single key column. Each model must contain one numeric or text column that uniquely identifies each record. Compound keys aren't permitted.
A predictable column. The model requires at least one predictable column. You can include multiple predictable attributes in a model, and the predictable attributes can be of different types, either numeric or discrete. Increasing the number of predictable attributes can increase processing time.
Input columns. The model requires input columns, which can be discrete or continuous. Increasing the number of input attributes affects processing time.
For detailed information about the supported content types and data types for decision tree models, see the Requirements section of the Microsoft Decision Trees Algorithm Technical Reference.
Viewing a decision tree model
To explore the model, use the Microsoft Tree Viewer. If your model generates multiple trees, you can select a tree and see a breakdown of how the cases are categorized for each predictable attribute. You can also view the interaction of the trees by using the dependency network viewer. For more information, see Browse a Model Using the Microsoft Tree Viewer.
For more detail about any branch or node in the tree, you can also browse the model by using the Microsoft Generic Content Tree Viewer. The content stored for the model includes the distribution for all values in each node, probabilities at each level of the tree, and regression formulas for continuous attributes. For more information, see Mining Model Content for Decision Tree Models (Analysis Services - Data Mining).
Creating predictions
After the model is processed, it stores the results as a set of patterns and statistics. Use these results to explore relationships or make predictions.
For examples of queries to use with a decision tree model, see Decision Trees Model Query Examples.
For general information about how to create queries against mining models, see Data Mining Queries.
Remarks
Supports the use of Predictive Model Markup Language (PMML) to create mining models.
Supports drillthrough.
Supports the use of OLAP mining models and the creation of data mining dimensions.
See also
Data Mining Algorithms (Analysis Services - Data Mining)
Microsoft Decision Trees Algorithm Technical Reference
Decision Trees Model Query Examples
Mining Model Content for Decision Tree Models (Analysis Services - Data Mining)