Bilješka
Pristup ovoj stranici zahtijeva provjeru vjerodostojnosti. Možete pokušati da se prijavite ili promijenite direktorije.
Pristup ovoj stranici zahtijeva provjeru vjerodostojnosti. Možete pokušati promijeniti direktorije.
The Application Insights Profiler for .NET captures detailed performance traces of your running app. It records how long individual methods take to run as your app handles live requests. Use these traces to identify the slow code paths that increase response times. You can pinpoint and fix performance problems in production.
From the .NET Profiler settings pane in the Azure portal, you can start profiling sessions on demand, configure triggers that run the Profiler automatically, and review recent profiling sessions.
To open the .NET Profiler settings pane, select Performance on the left menu on your Application Insights page.
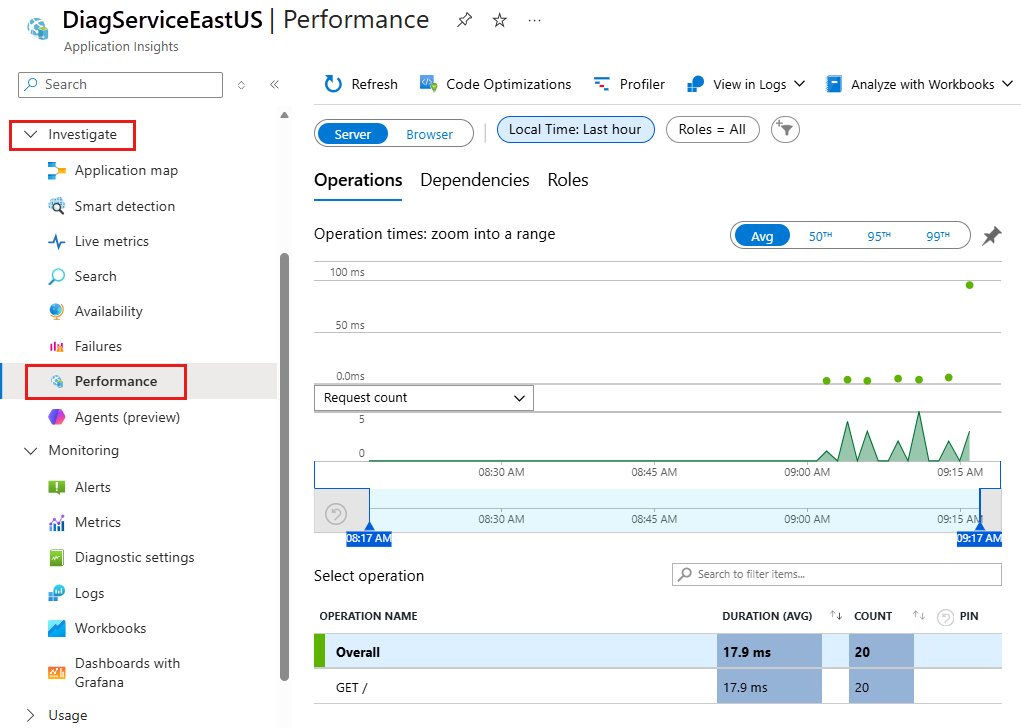
View .NET Profiler traces across Azure resources
View the .NET Profiler traces across your Azure resources by using two methods:
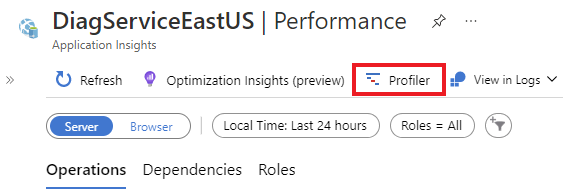
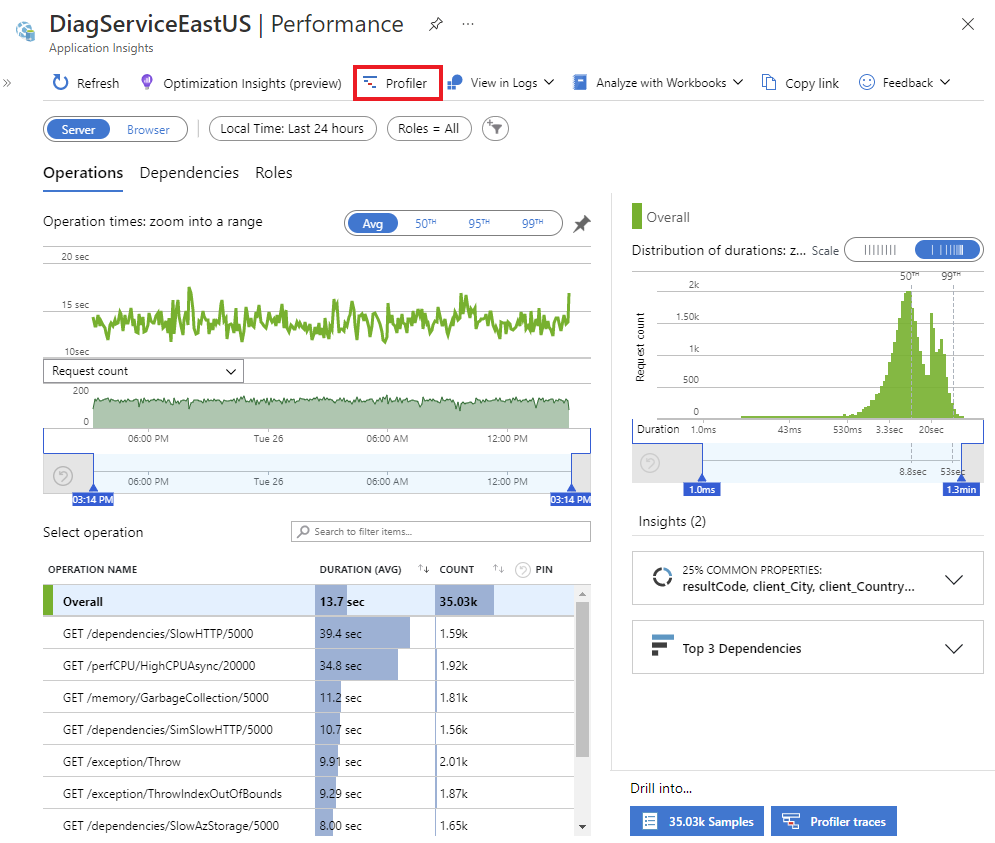
The Profiler button:
Select Profiler.
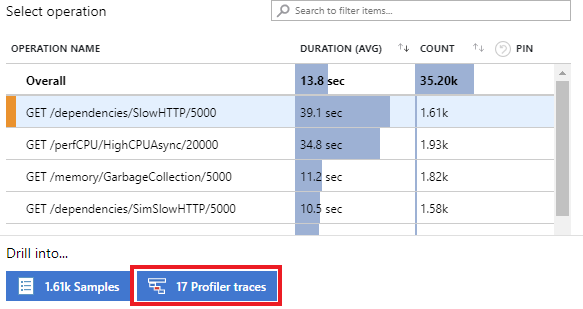
Operations:
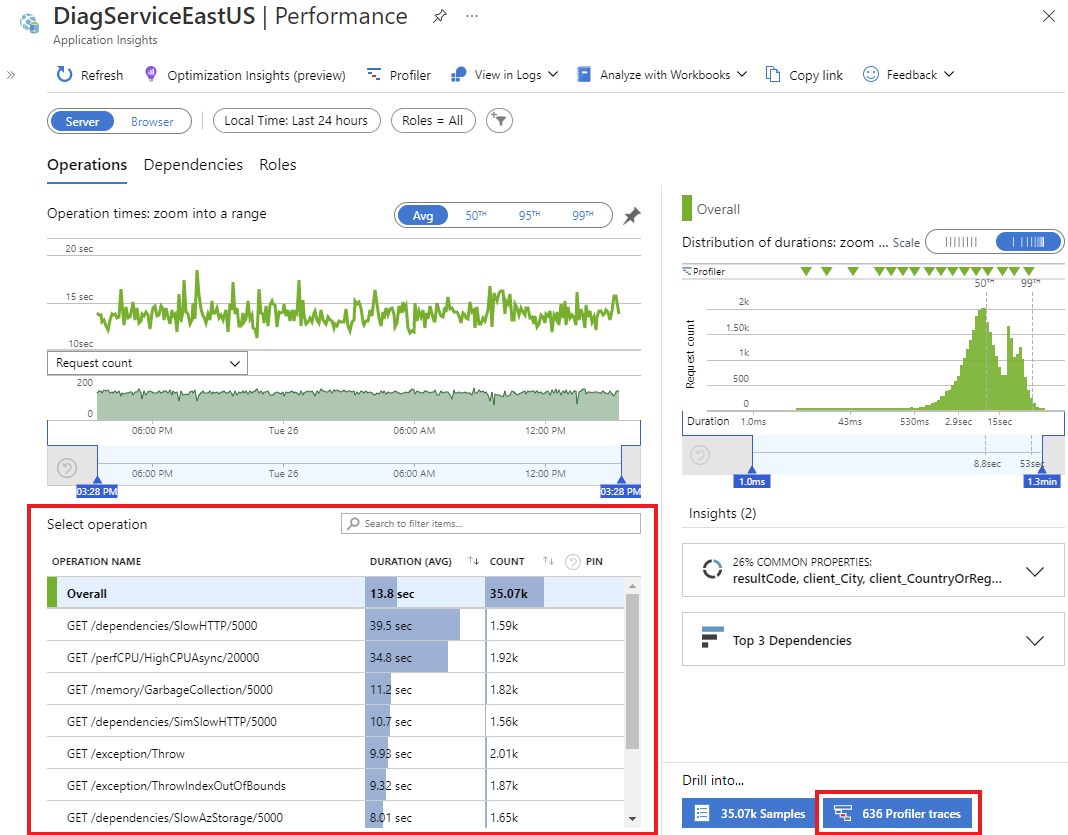
Select an operation from the Operation name list. The list highlights Overall by default.
Select Profiler traces.
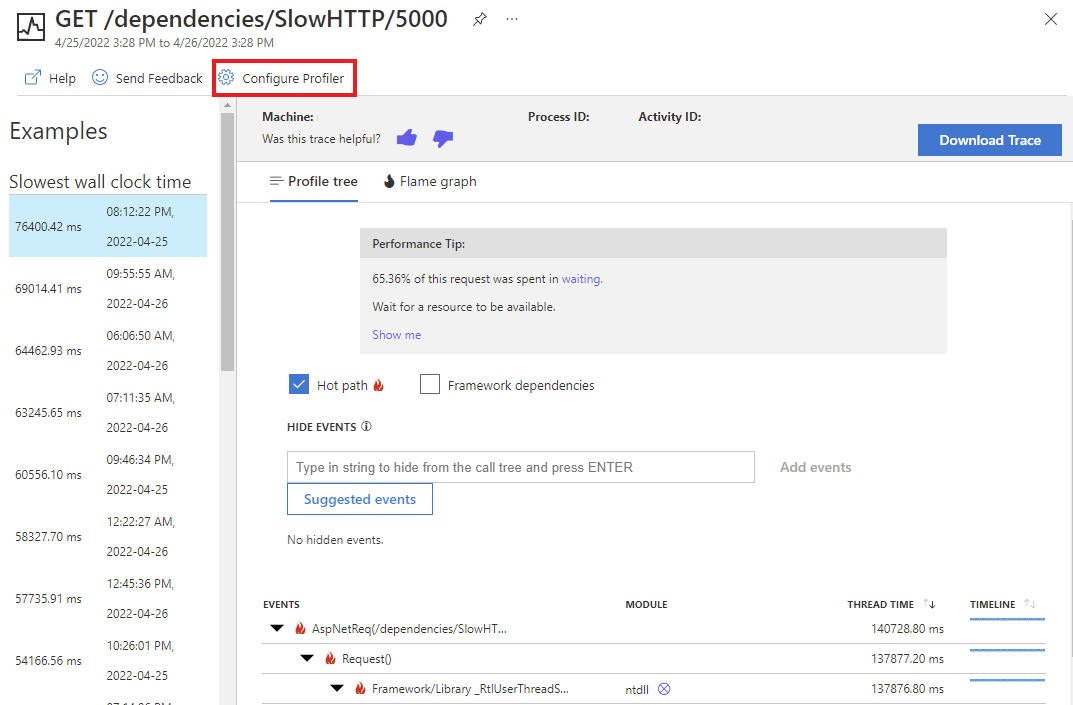
Select one of the requests from the list on the left.
Select Configure Profiler.

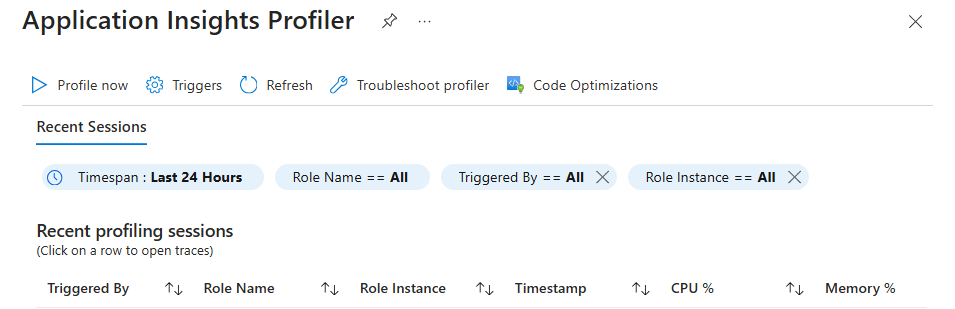
On the Profiler page, configure and view the .NET Profiler. The Application Insights Profiler for .NET page has the following features.
| Feature | Description |
|---|---|
| Profile now | Starts profiling sessions for all apps linked to this instance of Application Insights. |
| Triggers | Configures the triggers that cause the Profiler to run. |
| Recent profiling sessions | Shows information about past profiling sessions, which you can sort by using the filters at the top of the page. |
Profile now
Select Profile now to start a profiling session on demand. When you select this link, all Profiler agents that send data to this Application Insights instance start to capture a profile. After 5 to 10 minutes, the profiling session appears in the list.
To manually trigger a Profiler session, you need, at minimum, write access on your role for the Application Insights component. In most cases, you get write access automatically. If you're having issues, you need the Application Insights Component Contributor subscription scope role added. For more information, see Roles, permissions, and security in Azure Monitor.
Trigger settings
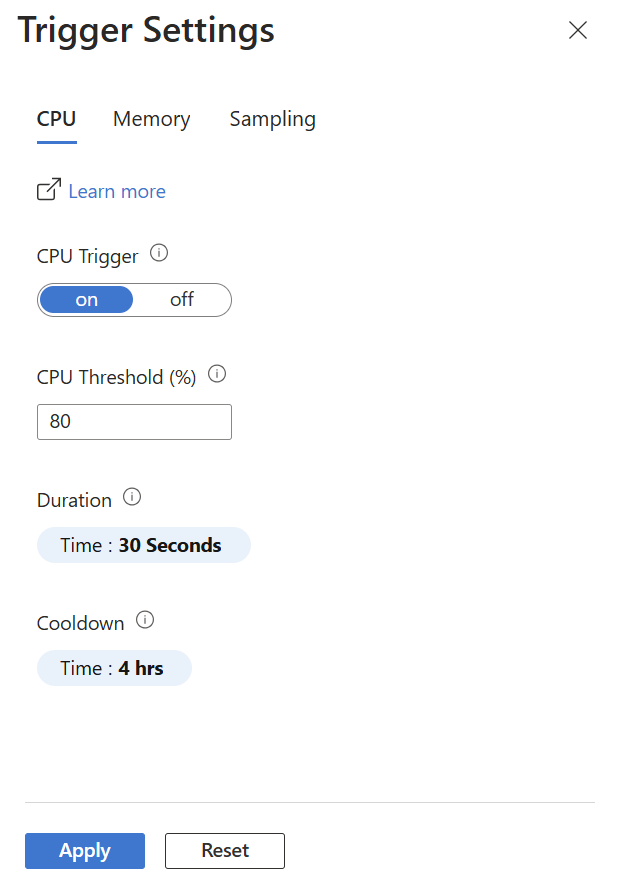
Select Triggers to open Trigger Settings. You can modify the CPU, Memory, and Sampling trigger tabs.
CPU or memory triggers
Set up a trigger to start profiling when the percentage of CPU or memory use hits the level you set.
| Setting | Description |
|---|---|
| On/Off button | On: Starts Profiler. Off: Doesn't start Profiler. |
| CPU threshold | When this percentage of CPU is in use, Profiler starts. |
| Memory threshold | When this percentage of memory is in use, Profiler starts. |
| Duration | Sets how long Profiler runs when triggered. The default is 30 seconds. |
| Cooldown | Sets how long Profiler waits before checking the CPU or memory usage again after it's triggered. |
Sampling trigger
Unlike CPU or memory triggers, the Sampling trigger doesn't respond to an event. Instead, it triggers randomly to get a truly random sample of your app's performance. You can:
- Turn this trigger off to disable random sampling.
- Set how often profiling occurs and the duration of the profiling session.
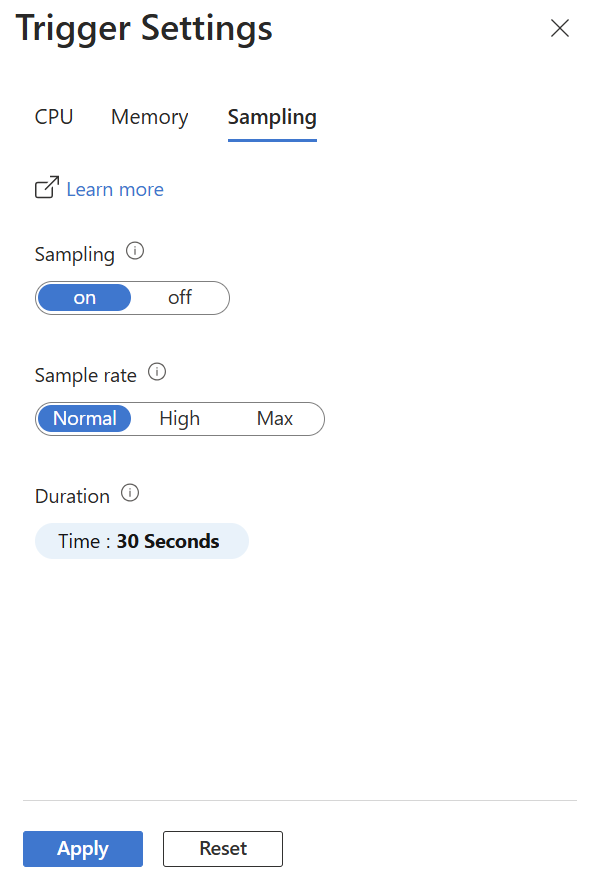
| Setting | Description |
|---|---|
| On/Off button | On: Starts Profiler. Off: Doesn't start Profiler. |
| Sample rate | How often the Profiler runs. Use the Normal setting for production environments. |
| Duration | Sets how long Profiler runs when triggered. The default is 30 seconds. |
The Sample rate setting has three options:
- The Normal setting collects data 5% of the time, which is about three minutes per hour.
- The High setting profiles 50% of the time.
- The Maximum setting profiles 75% of the time.
Recent profiling sessions
This section of the Profiler page shows recent profiling session information. A profiling session represents the time the Profiler agent takes to profile one of the machines that host your app. Open the profiles from a session by selecting one of the rows. For each session, you see the following settings:
| Setting | Description |
|---|---|
| Triggered by | How the session started, either by a trigger, Profile now, or default sampling. |
| App Name | Name of the profiled app. |
| Machine Instance | Name of the machine the Profiler agent ran on. |
| Timestamp | Time when the Profiler captured the profile. |
| CPU % | Percentage of CPU that the Profiler used while running. |
| Memory % | Percentage of memory that the Profiler used while running. |