Bilješka
Pristup ovoj stranici zahtijeva provjeru vjerodostojnosti. Možete pokušati da se prijavite ili promijenite direktorije.
Pristup ovoj stranici zahtijeva provjeru vjerodostojnosti. Možete pokušati promijeniti direktorije.
Snapshots appear as Exceptions in the Application Insights pane of the Azure portal. View debug snapshots in the Azure portal to examine the call stack and inspect variables at each call stack frame.
For a more powerful debugging experience with source code, open snapshots with Visual Studio Enterprise. You can also set SnapPoints to interactively take snapshots without waiting for an exception. For more information, see Debug live ASP.NET Azure apps.
Prerequisites
Snapshots might include sensitive information. You can view snapshots only if you have the Application Insights Snapshot Debugger role.
Access debug snapshots in the Azure portal
After an exception occurs in your application and Snapshot Debugger creates a snapshot, you can view snapshots in the Azure portal within 5 to 10 minutes.
View snapshots from the Failures pane
In your Application Insights resource, in the left menu, select Investigate > Failures.
In the Failures pane, select either:
- The Operations tab
- The Exceptions tab
Select the [x] Samples in the center column of the page to generate a list of sample operations or exceptions to the right.
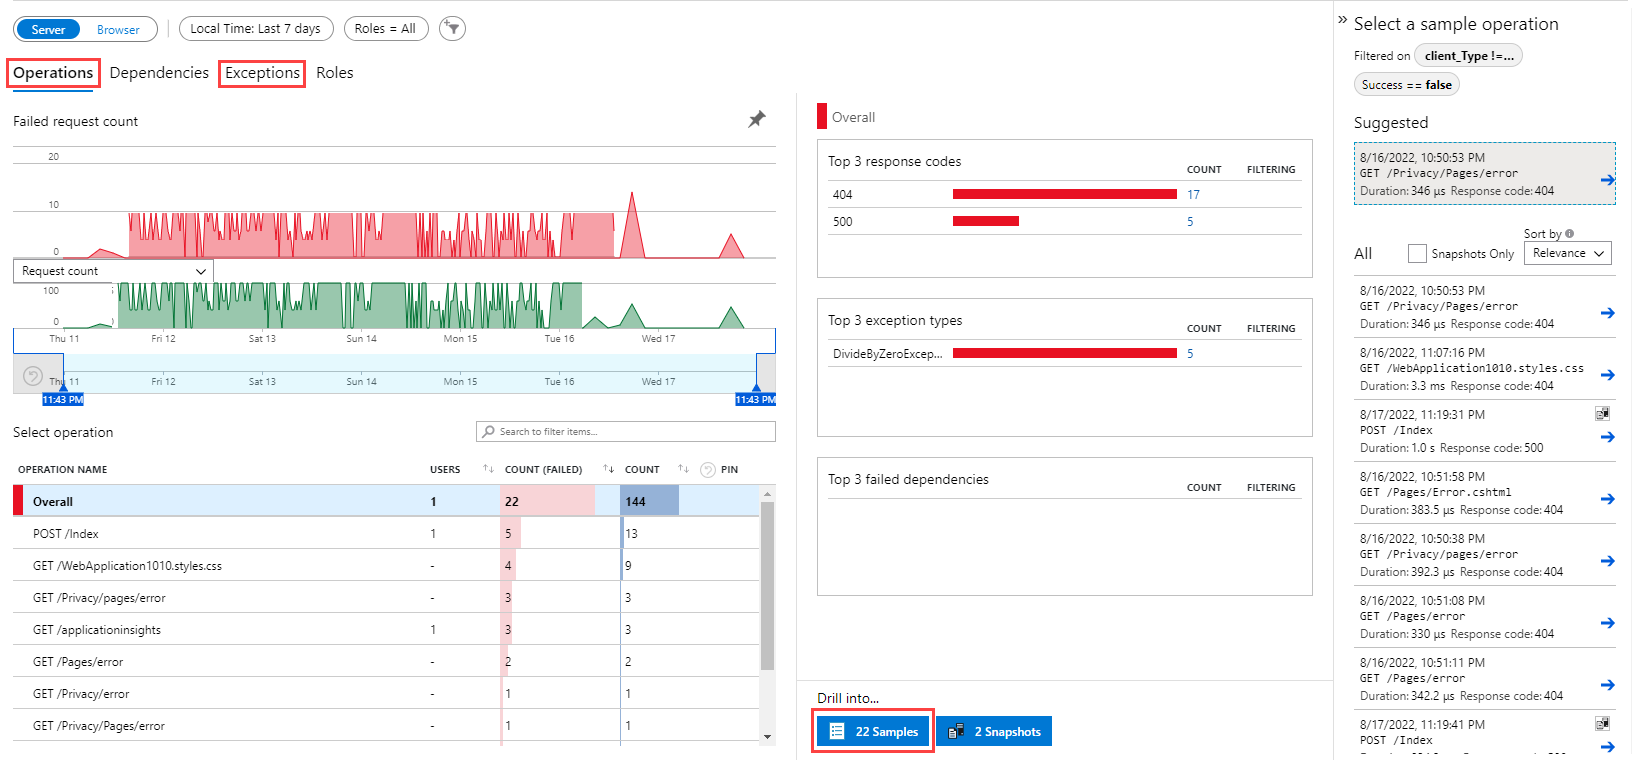
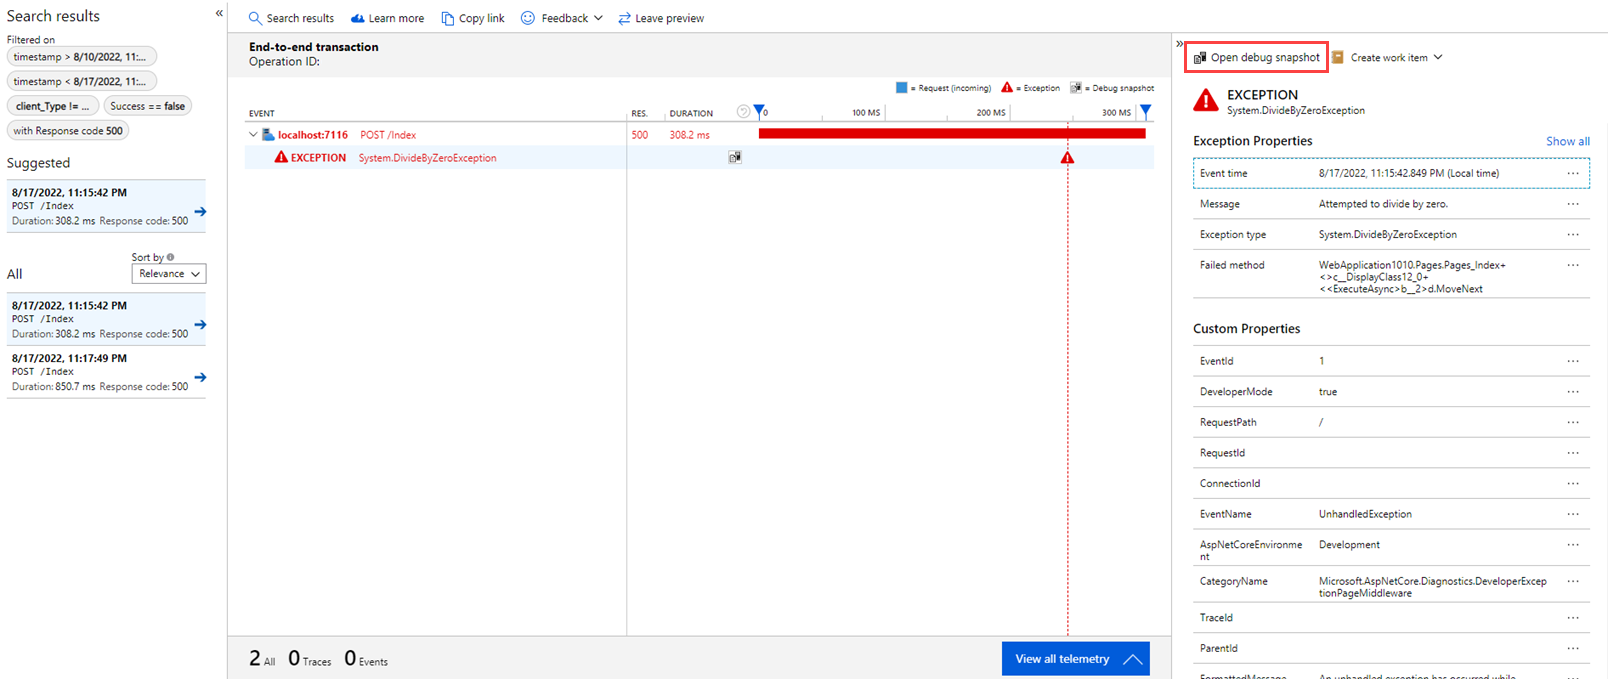
From the list of samples, select an operation or exception to open the End-to-End Transaction Details page. From here, select the exception event you want to investigate.
- If a snapshot is available for the given exception, select Open debug snapshot in the right pane to view the Debug Snapshot page.
- If you don't see this option, a snapshot might not be available. See the troubleshooting guide.
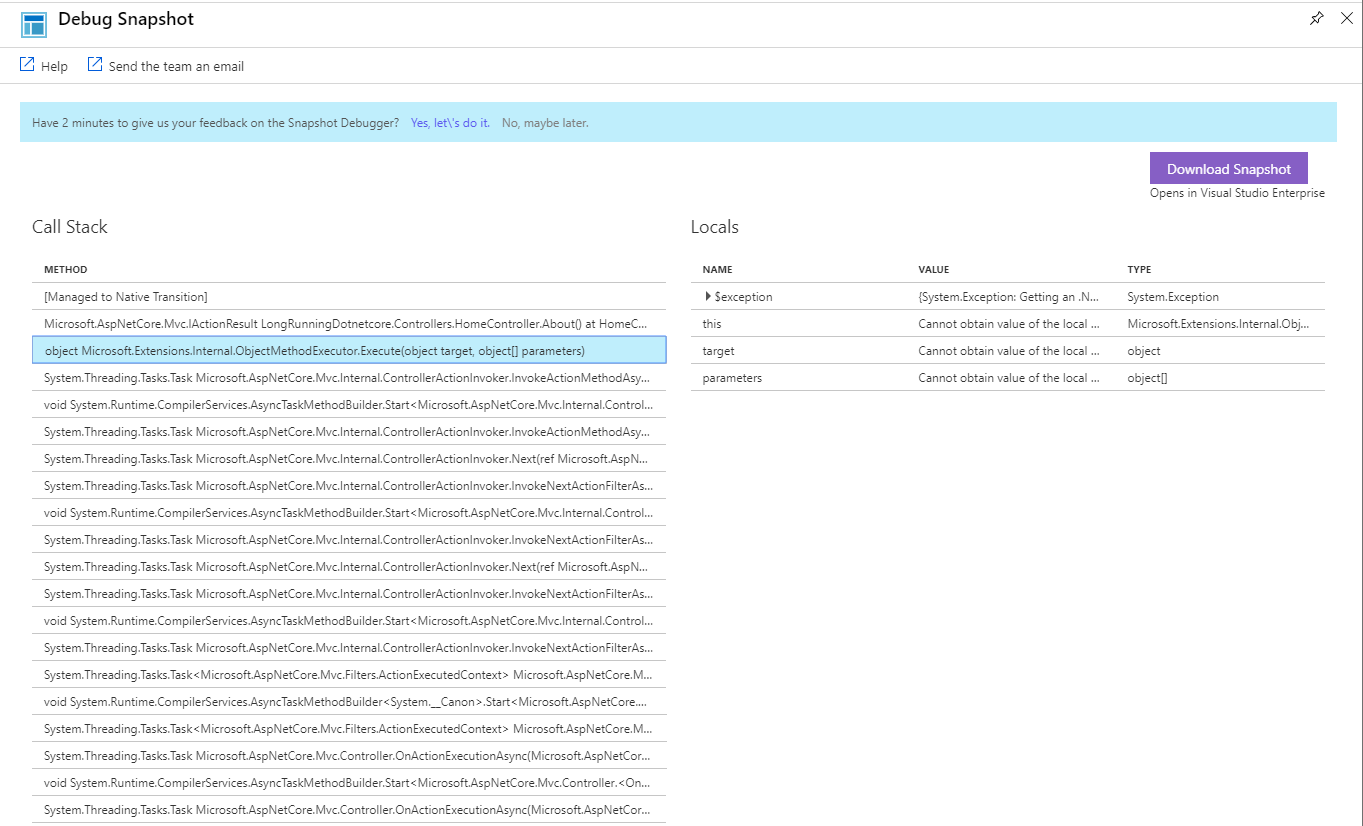
In the Debug Snapshot page, you see a call stack with a local variables pane. Select a call stack frame to view local variables and parameters for that function call in the variables pane.
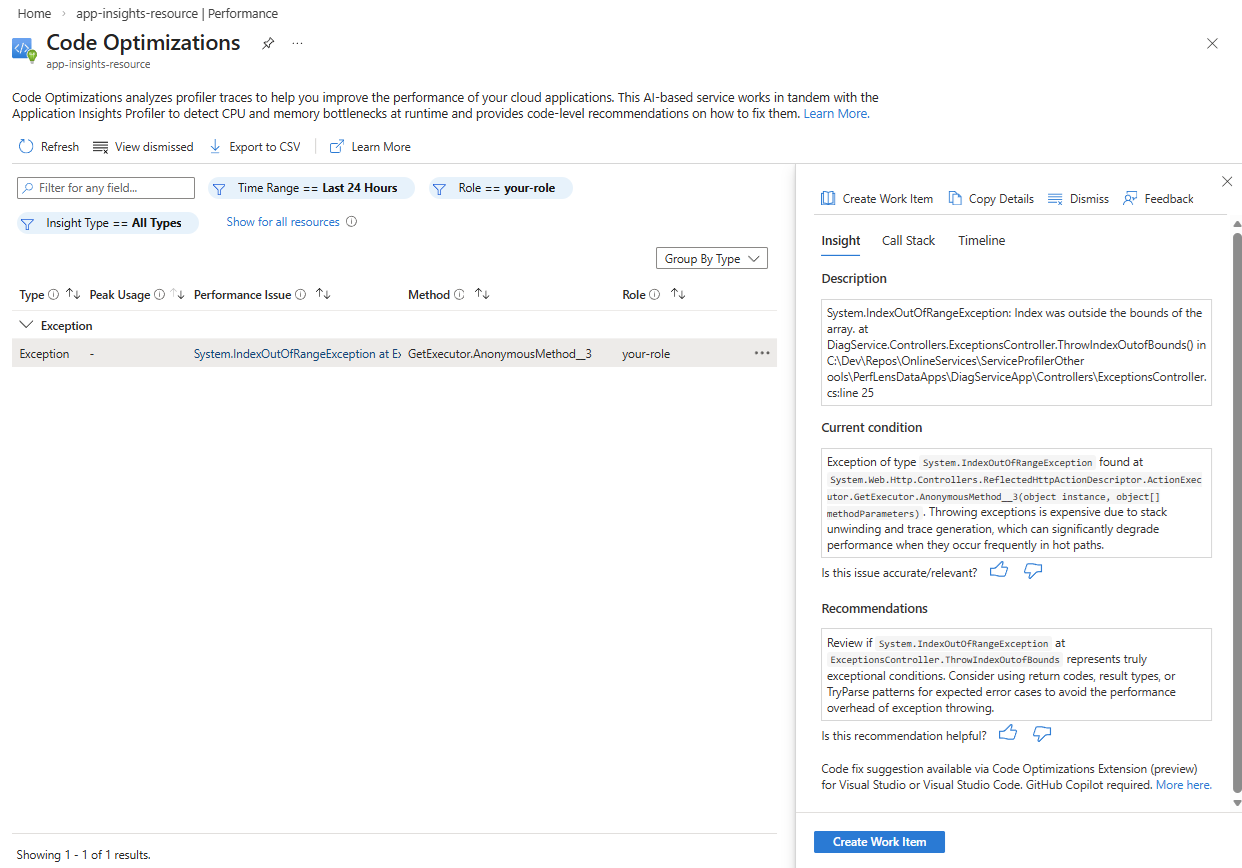
View exception snapshots in the Code Optimizations consolidated overview
You can also view insights on your exception snapshots by using the Code Optimizations consolidated overview page.
In the Azure portal, search for Code Optimizations.
Use the filters to narrow results to your specific Azure subscription and resource.
Under the Insight type column in the results window, look for Exceptions.
Download snapshots to view in Visual Studio
To view snapshots in Visual Studio 2017 Enterprise or greater:
Select Download Snapshot in the Debug Snapshot page to download a
.diagsessionfile, which Visual Studio Enterprise can open.In Visual Studio, make sure you have the Snapshot Debugger Visual Studio component installed.
- For Visual Studio 2017 Enterprise and greater: Select the required Snapshot Debugger component from the Individual Component list in the Visual Studio installer.
- For a version older than Visual Studio 2017 version 15.5: Install the extension from the Visual Studio Marketplace.
Open the
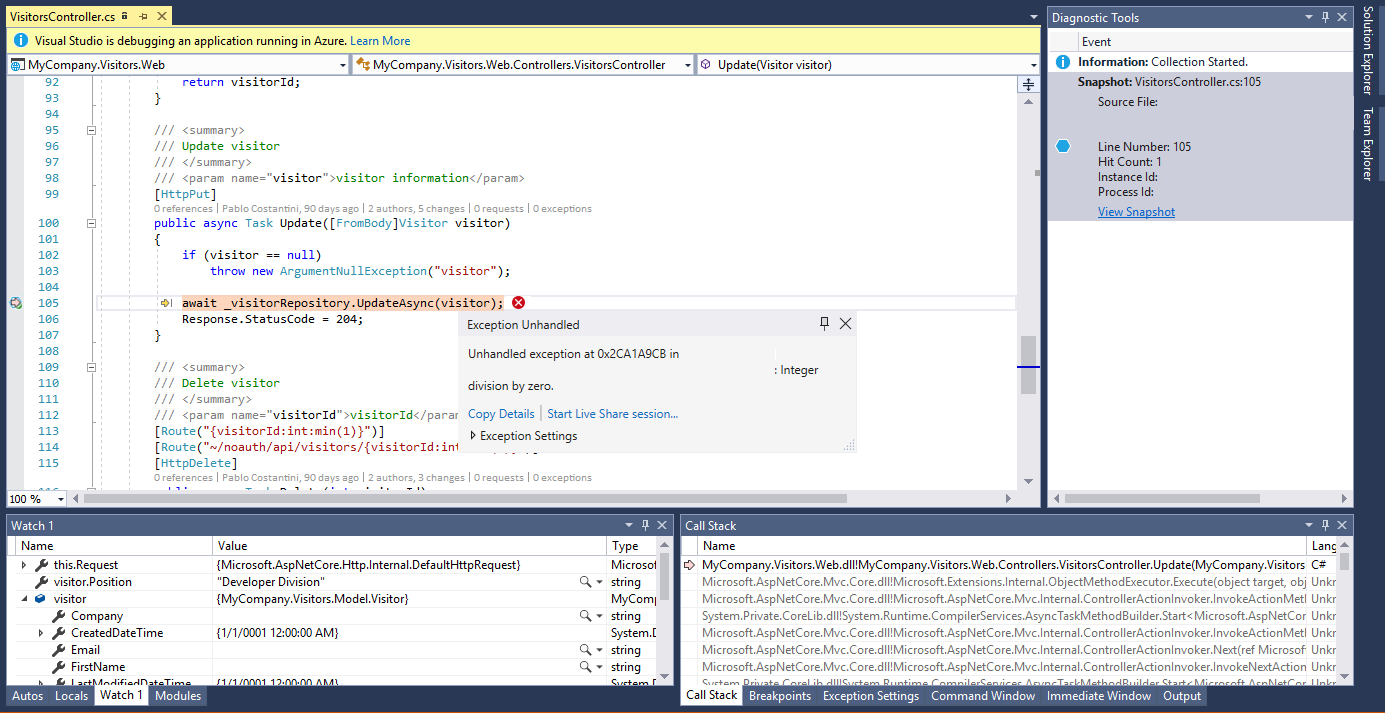
.diagsessionfile in Visual Studio to generate the Minidump Debugging page.Select Debug Managed Code to start debugging the snapshot. The snapshot opens to the line of code that threw the exception.
Note
The downloaded snapshot includes any symbol files on your web application server. You need these symbol files to associate snapshot data with source code. For App Service apps, ensure you enable symbol deployment when you publish your web apps.
Related content
Enable the Snapshot Debugger in your: