Bilješka
Pristup ovoj stranici zahtijeva provjeru vjerodostojnosti. Možete pokušati da se prijavite ili promijenite direktorije.
Pristup ovoj stranici zahtijeva provjeru vjerodostojnosti. Možete pokušati promijeniti direktorije.
Grafana supports data source, panel, and app plugins. When you create a Grafana workspace, Azure installs some plugins by default, such as Azure Monitor. This article shows you how to add or remove optional plugins.
Note
You can install and remove plugins only from the Azure Managed Grafana workspace in the Azure portal. You can't manage plugins from the Grafana UI or Azure CLI.
Prerequisites
Add a plugin
To install Grafana plugins, follow the process below.
Important
Before adding plugins to your Grafana instance, we recommend that you evaluate these plugins to ensure that they meet your organizational standards for quality, compliance, and security. Third-party plugins have their own release frequency, security implications, testing and update processes that are outside of Microsoft control. Ultimately, it is up to you to determine which plugins meet your requirements and security needs.
Open your Azure Managed Grafana instance in the Azure portal.
Select Plugin management. This page shows a table with three columns containing checkboxes, plugin names, and plugin IDs. Review the checkboxes. A checked box indicates that the corresponding plugin is already installed and can be removed, an unchecked box indicates that the corresponding plugin isn't installed and can be added.
Note
This page only shows optional plugins. Core Grafana plugins that are included in your pricing plan by default aren't listed here.
Select a plugin to add to your Grafana instance by checking its checkbox.
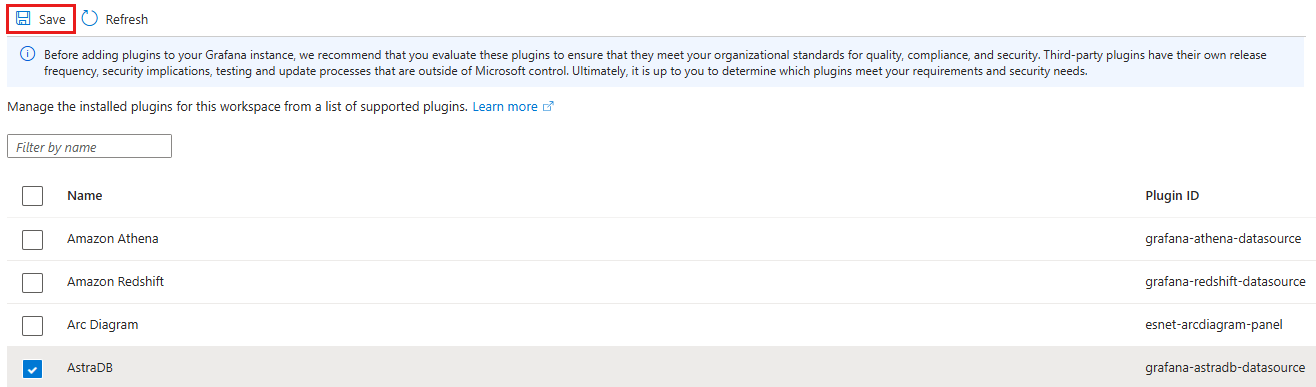
Select Save. Azure displays a message stating which plugins will be added or removed. Select Yes to confirm. Once the update is complete, a success message is displayed and the list of plugins is updated.
Remove a plugin
To remove a plugin that isn't part of the Grafana built-in core plugins, follow the steps below.
Caution
Removing a data source that is used in a dashboard will make the dashboard unable to collect the corresponding data and will trigger an error or result in no data being shown in the panel.
Open your Azure Managed Grafana instance in the Azure portal.
Select Plugin management. This page displays a table with data source plugins. It contains three columns including checkboxes, plugin names, and plugin IDs. Installed plugins are displayed at the top of the list and have an Installed tag.
Clear the checkbox for the plugin that you want to remove from your Grafana instance.
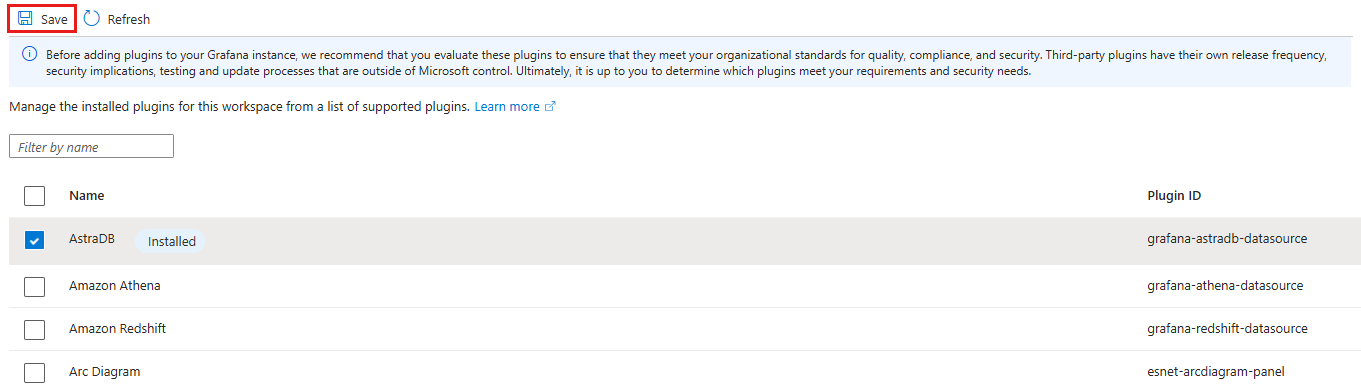
Select Save. Azure displays a message stating which plugins will be added or removed. Select Yes to confirm. Once the update is complete, a success message is displayed and the list of plugins is updated.
Next steps
Now that you know how to add and remove plugins, learn how to manage data sources.