Bilješka
Pristup ovoj stranici zahtijeva provjeru vjerodostojnosti. Možete pokušati da se prijavite ili promijenite direktorije.
Pristup ovoj stranici zahtijeva provjeru vjerodostojnosti. Možete pokušati promijeniti direktorije.
In this article, you learn how to use Azure Monitor metric charts to monitor an Azure Managed Grafana workspace.
In Azure Monitor, metrics are a series of measured values and counts that are collected and stored over time. These metrics reflect the health and usage statistics of your Azure resources.
Prerequisites
- An Azure account with an active subscription. Create an account for free.
- An Azure Managed Grafana workspace. If you don't have one yet, create an Azure Managed Grafana instance.
Supported metrics
The following metrics are available for the Microsoft.Dashboard/grafana resource type.
| Metric | Description | Unit | Aggregations | Dimension |
|---|---|---|---|---|
HttpRequestCount |
The number of HTTP requests to the Azure Managed Grafana server. | Count | Count | None |
MemoryUsagePercentage |
The Azure Managed Grafana workspace memory usage in percent. | Percent | Count, Average, Minimum, Maximum | ContainerName |
NetworkBytesReceived |
Total bytes received by Grafana over the network. | Bytes | Average, Minimum, Maximum, Total (Sum) | ContainerName |
NetworkBytesTransmitted |
Total bytes transmitted by Grafana over the network. | Bytes | Average, Minimum, Maximum, Total (Sum) | ContainerName |
You collect all metrics at one-minute granularity. You can't export them to Azure Monitor Logs through diagnostic settings.
For more details about supported metrics, go to Supported metrics for Microsoft.Dashboard/grafana.
Create a metric chart
These metrics can be accessed from your Azure Managed Grafana workspace, from Azure Monitor, and through the Azure Monitor API. The following section details how to create a metric chart in an Azure Managed Grafana workspace, in the Azure portal.
Open a Managed Grafana resource and go to Monitoring > Metrics.
Configure your chart:
- The portal prepopulates the scope and metric namespace.
- Select a metric from the list.
- Select an aggregation type: Count, Avg, Min, Max, or Sum.
- Select the time range and granularity that are relevant for your investigation.
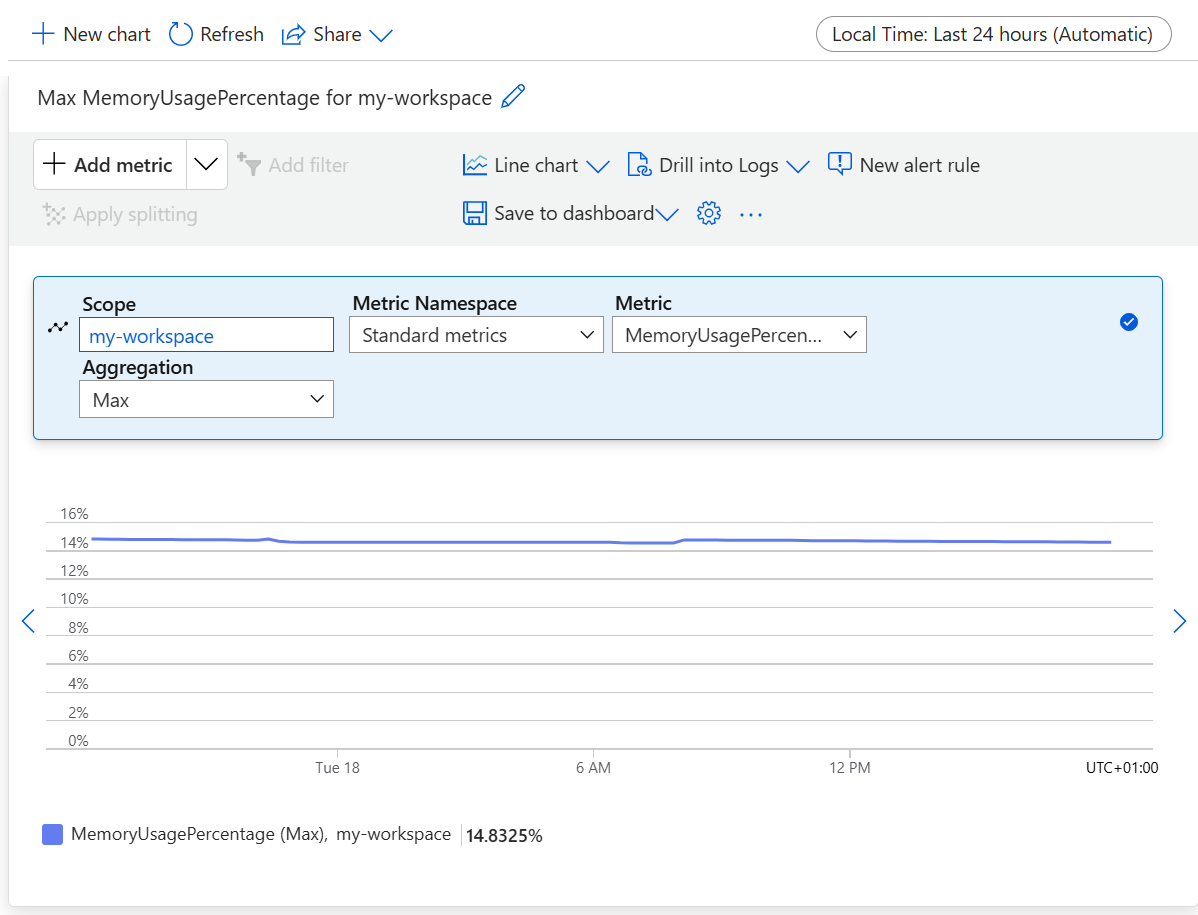
Optionally, create an alert rule to receive a notification if the metric exceeds or drops below a threshold. You can also pin the chart to an Azure dashboard, a Grafana workspace, or a workbook.