Bilješka
Pristup ovoj stranici zahtijeva provjeru vjerodostojnosti. Možete pokušati da se prijavite ili promijenite direktorije.
Pristup ovoj stranici zahtijeva provjeru vjerodostojnosti. Možete pokušati promijeniti direktorije.
In this guide, learn how to share Grafana dashboards with internal and external stakeholders, collaborate with team members, generate files and reports, or share information publicly.
This article covers information about sharing access to Grafana dashboards with internal stakeholders, managing dashboard permissions, and generating the following dashboard elements:
- Direct links.
- Snapshots.
- Library panels.
- JSON or PDF files.
- Reports.
Note
The Grafana UI changes periodically, so your experience might differ from the examples in this article. For current interface details, see the Grafana Labs documentation.
Prerequisites
- An Azure account with an active subscription. Create an account for free.
- An Azure Managed Grafana workspace. If you don't have one yet, create an Azure Managed Grafana workspace.
Share access with team members
To access dashboards, team members must have access to the Grafana workspace. To enable access, start by assigning them a Grafana role on the Grafana workspace, if they don't have one yet.
By default, all Grafana roles grant view access to all Grafana dashboards, except for the Grafana Limited Viewer role, which requires permissions to be specifically granted per dashboard. This granular control ensures that identities with the Grafana Limited Viewer role only access the specific dashboards they need, enhancing security and data privacy.
Once a user has a Grafana role and has signed into the Grafana portal, you can modify their access permissions for specific dashboards by following the process below:
- Open the Grafana portal with the dashboard you want to share.
- Open the dashboard, then go to Settings > Permissions > Add a permission.
- Under Add permission for, select a user and grant them view, edit, or admin permissions.
Note
Grafana users need to open the Grafana endpoint at least once before they appear in the Add Permissions menu. Once the user has logged in, you can edit their permissions.
Use the Grafana dashboard and panel sharing options
The Grafana portal provides several options to share access to Grafana dashboards and panels to various stakeholders. To access these sharing options:
- In the Grafana portal, go to Dashboards > Browse, and open a dashboard.
- Open sharing options:
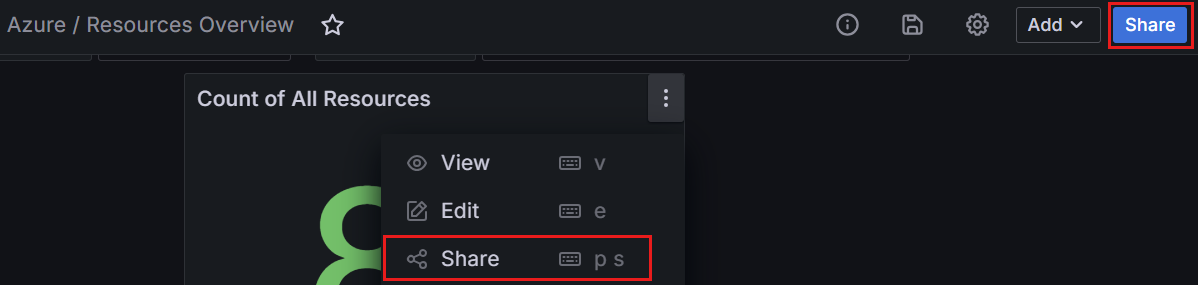
To share a whole dashboard, select Share at the top of the page.
To share a single dashboard panel, hover over a panel title, open the panel menu, and select Share. A new window opens with various sharing options.
Tip
If you update a dashboard or panel, save your changes before sharing it so that the shared version contains your latest changes.
For more information about the sharing methods presented below, refer to Grafana's Share dashboards and panels documentation.
Share a link
The Link tab lets you create a direct link to a Grafana dashboard or panel.
Create a shareable link by selecting Copy at the bottom of the tab. You can customize sharing with the following options:
- Lock time range: sets the time range of the shared panel or dashboard to the time range currently displayed in your shared panel or dashboard.
- Theme: keep the current theme or choose a dark or a light theme.
- Shorten URL: Shortens the shareable link.
Note
Users must have Grafana Viewer permission to view shared links.
Share a snapshot
Use the Snapshot tab to share an interactive dashboard or panel publicly. The snapshot removes queries, including metric, template, and annotation queries, and panel links. However, the visible metric data and series names remain embedded in the dashboard. Anyone who has the link and can access the URL can view this data. Review the snapshot for sensitive information before you publish it.
- Optionally update the snapshot name, select an expiry date, and change the time-out value.
- To publish the Grafana snapshot, choose one of the following options:
- Publish to snapshots.raintank.io to make it accessible publicly to anyone with the link.
- Local Snapshot, to restrict access to users who are registered in your Microsoft Entra tenant.
- Copy the snapshot URL generated by Grafana. Select Delete snapshot if you no longer need it.
Tip
To disable public sharing of snapshots, open your Azure Managed Grafana workspace within the Azure portal, then go to Settings > Configuration > Grafana Settings (Preview), and turn off the External Enabled option.
Create a library panel
Create a library panel that can be reused in other Grafana dashboards from the Library panel tab. Do this in a single step by selecting the Create library panel at the bottom of the tab. Optionally update the panel library name and select another folder in which to save the library panel.
Once you've created a library panel, reuse it in other dashboards of the same Grafana workspace by going to Dashboards > New dashboard > Add panel from panel library.
Export dashboard as JSON file
Export a dashboard in JSON format from the Export tab. Select Save to file to download the JSON file, or select View JSON > Copy to Clipboard.
Export for sharing externally is disabled by default. Optionally enable this option to generate JSON code for external stakeholders. The exported dashboard can then be imported to Grafana.
Save as PDF
Save a dashboard as a PDF from the PDF tab. Customize your PDF by selecting the desired Orientation (landscape or portrait) and Layout (grid or simple), and optionally zoom in or out to adjust the number of rows and columns displayed in table panels. Select Save as PDF to download the file.
Generate a report
Generate a dashboard report from the Report tab. For more information, see Use reporting and image rendering and Create or update a report.