Bilješka
Pristup ovoj stranici zahtijeva provjeru vjerodostojnosti. Možete pokušati da se prijavite ili promijenite direktorije.
Pristup ovoj stranici zahtijeva provjeru vjerodostojnosti. Možete pokušati promijeniti direktorije.
Eventstream workspace monitoring (preview) uses Fabric workspace monitoring. To enable workspace monitoring for eventstreams, complete the following steps:
- Enable workspace monitoring at the workspace level and create an Eventhouse in your workspace. The Eventhouse is a monitoring database that contains tables for monitoring data from all supported items in the workspace, including eventstreams.
- Enable workspace monitoring at the eventstream level.
This article provides instructions for enabling workspace monitoring for eventstreams. For more information about workspace monitoring, see Eventstream workspace monitoring overview.
Important
Eventstream workspace monitoring is currently in preview.
Prerequisites
- A Power BI Premium or a Fabric capacity.
- The Workspace admins can turn on monitoring for their workspaces tenant setting is enabled. To enable the setting, you need to be a Fabric administrator. If you're not a Fabric administrator, ask the Fabric administrator in your organization to enable the setting.
- You have the admin role in the workspace.
- Workspace monitoring is enabled at the workspace level, and Log Eventstream activity is enabled for each eventstream. Enabling workspace monitoring for the workspace doesn't automatically enable activity logging for eventstreams.
Enable monitoring at workspace level
Go to your workspace settings and enable monitoring by creating an eventhouse.
Go to the workspace where your eventstreams are located.
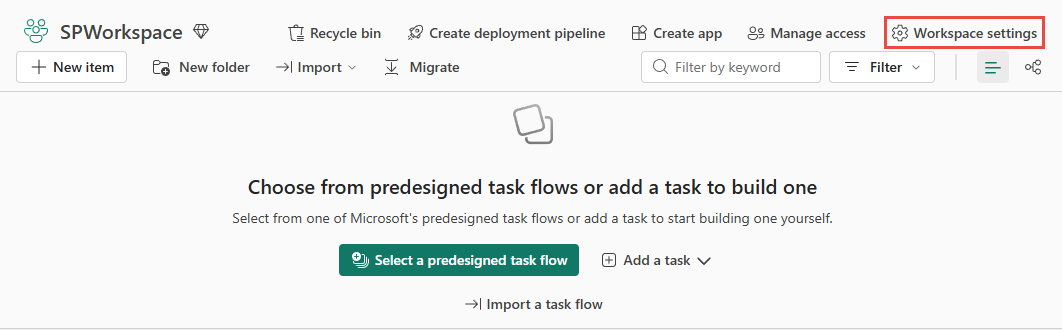
Select Workspace settings.
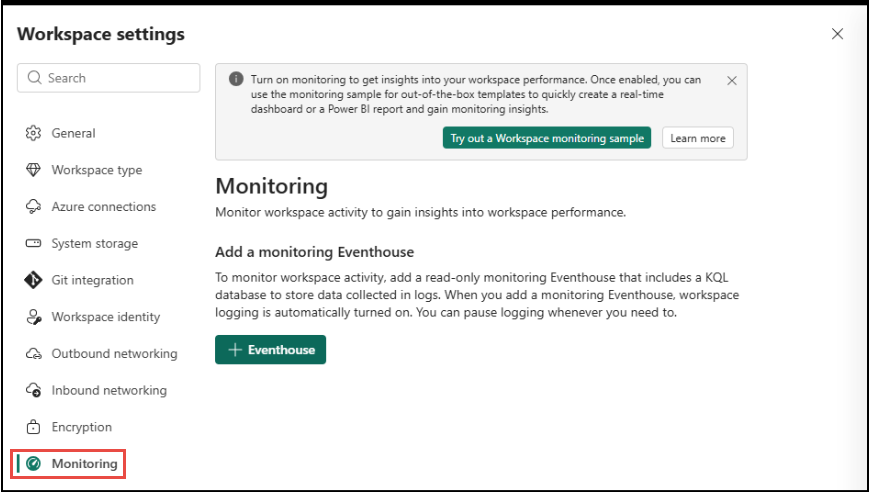
In the left navigation of Workspace settings, select Monitoring.
Select + Eventhouse and wait for the monitoring database to be created.
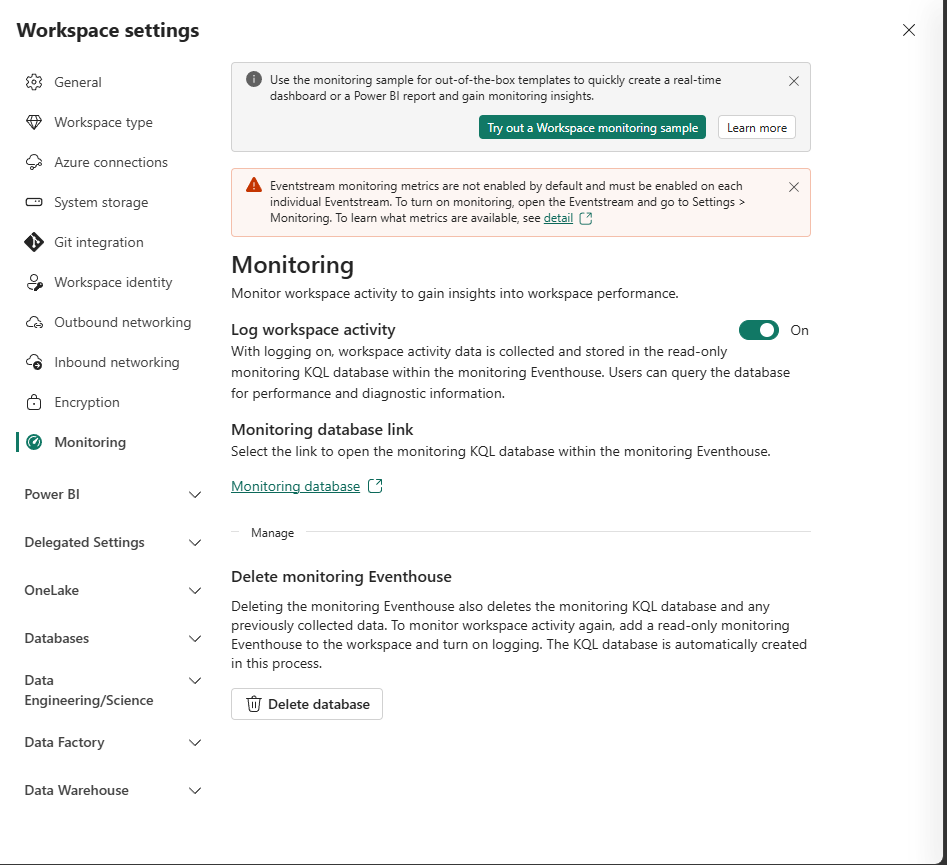
After the eventhouse is created, Fabric begins collecting monitoring data from all supported items in the workspace, including your eventstreams.
Enable workspace monitoring for Eventstreams
To enable workspace monitoring for an eventstream, follow these steps:
Go to the eventstream you want to monitor.
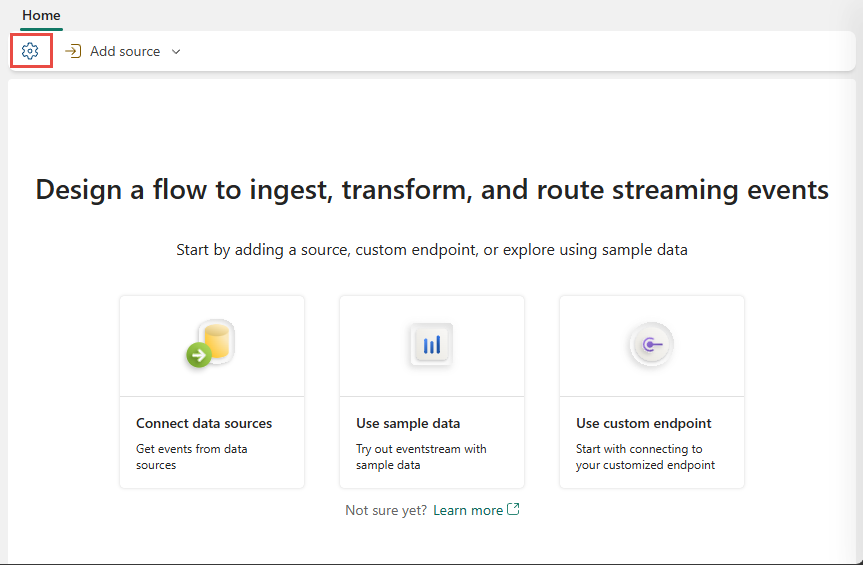
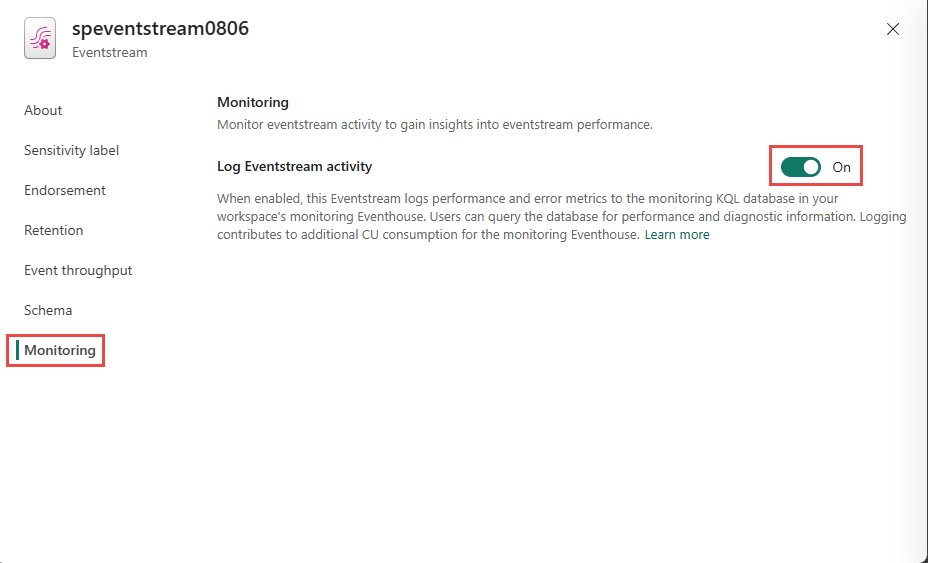
Select Settings.
Select Monitoring.
Toggle the Log Eventstream activity option to On.
Open the monitoring database
Locate and explore the monitoring eventhouse to verify the Eventstream tables are available.
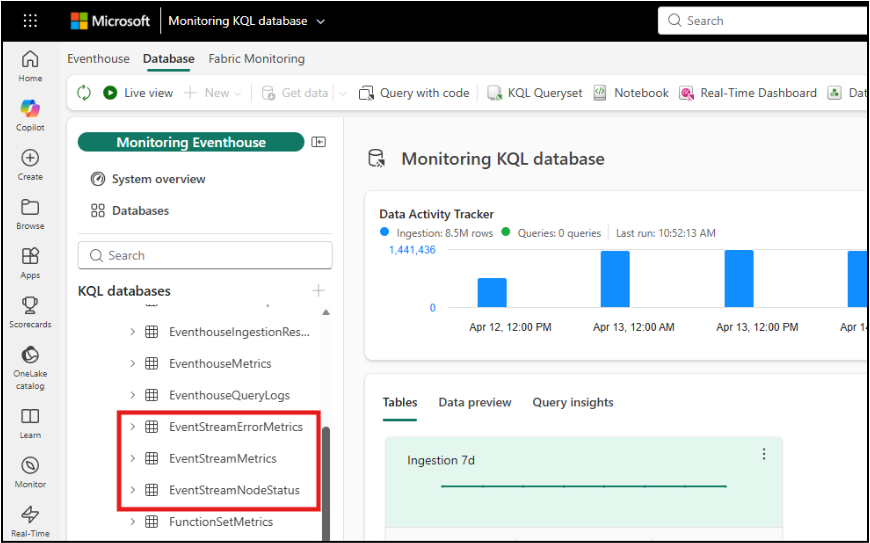
In your workspace, locate the monitoring eventhouse that was created (it appears as an Eventhouse item).
Open the eventhouse and expand the database to see the available tables.
Look for the three Eventstream tables: EventStreamNodeStatus, EventStreamMetrics, and EventStreamErrorMetrics.
Note
It might take a few minutes after enabling monitoring for data to start appearing in the tables. Node status data is emitted periodically (approximately every six hours), so the EventStreamNodeStatus table might take longer to populate than the metrics tables.
