Bemærk
Adgang til denne side kræver godkendelse. Du kan prøve at logge på eller ændre mapper.
Adgang til denne side kræver godkendelse. Du kan prøve at ændre mapper.
This article explains how to debug code components during development and after deployment to Microsoft Dataverse. Use unit tests to validate component logic independently of the Power Apps component framework runtime.
This article shows how to debug your code components using the test harness and after deploying to Microsoft Dataverse:
- Debug code components
Debug code components with the browser test harness
While you're implementing the code component logic, using npm start or npm start watch builds the code component and open the local test harness in a new browser window. This test harness is part of Microsoft Power Platform CLI and hence is the same irrespective of if you plan to use your code component in model-driven apps, canvas apps, or portals. More information: Create your first component.
Note
Before you can use npm start you need to check if npm is installed in your machine.
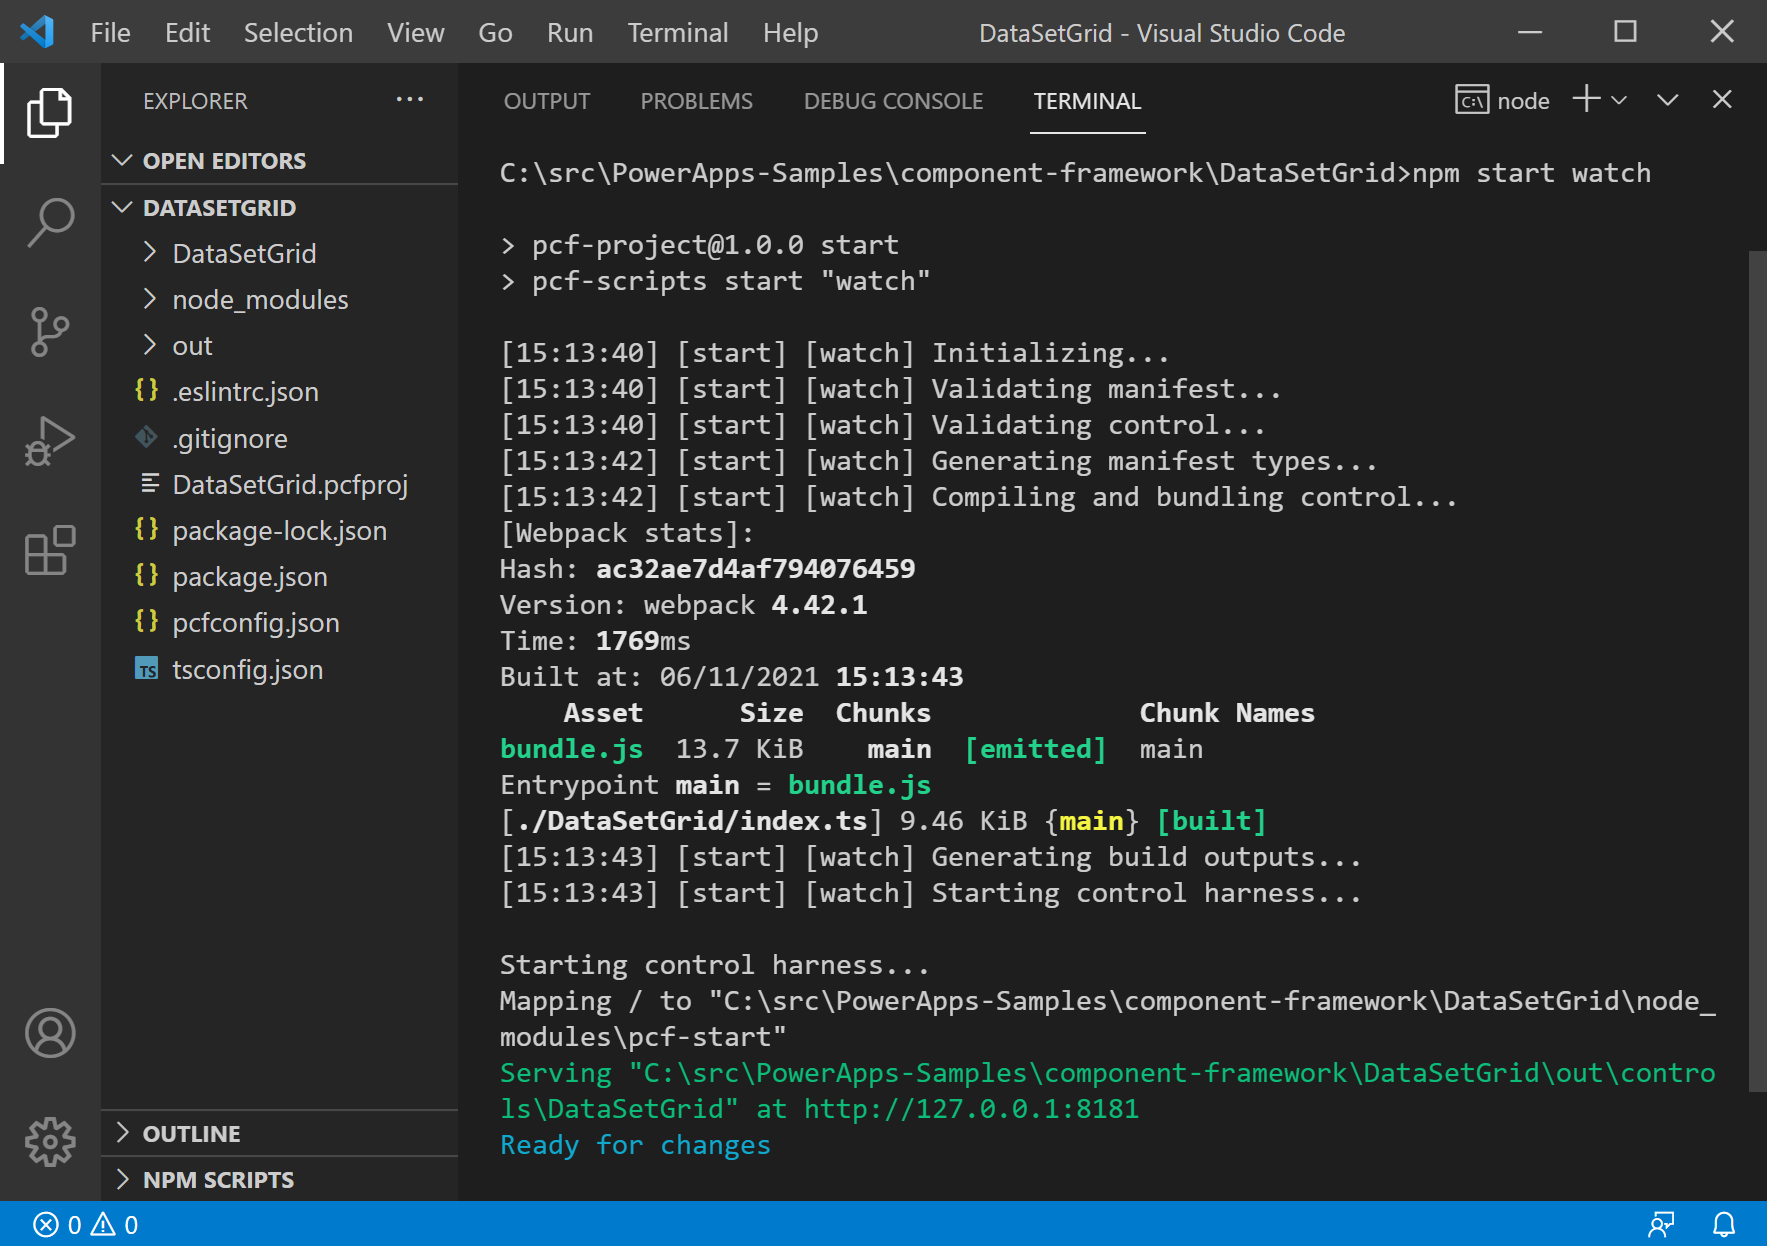
The following image shows what Visual Studio Code looks like when you use the npm start watch for the DataSetGrid sample:
Launching the test harness in watch mode enables you to quickly see the changes in action. Changes made to any of the following component assets are automatically reflected in the test harness without having to restart it:
index.tsfile.- Imported modules in
index.ts(excluding node_modules). - All of the resources listed in the
ControlManifest.Input.xmlfile, for example,css/DataSetGrid.cssorstrings/DataSetGrid.1033.resx
If you make changes to any of these files, you'll see a Change detected message and the browser reloads with the updated code.

The following image shows the test harness once it's opened in a new browser window:
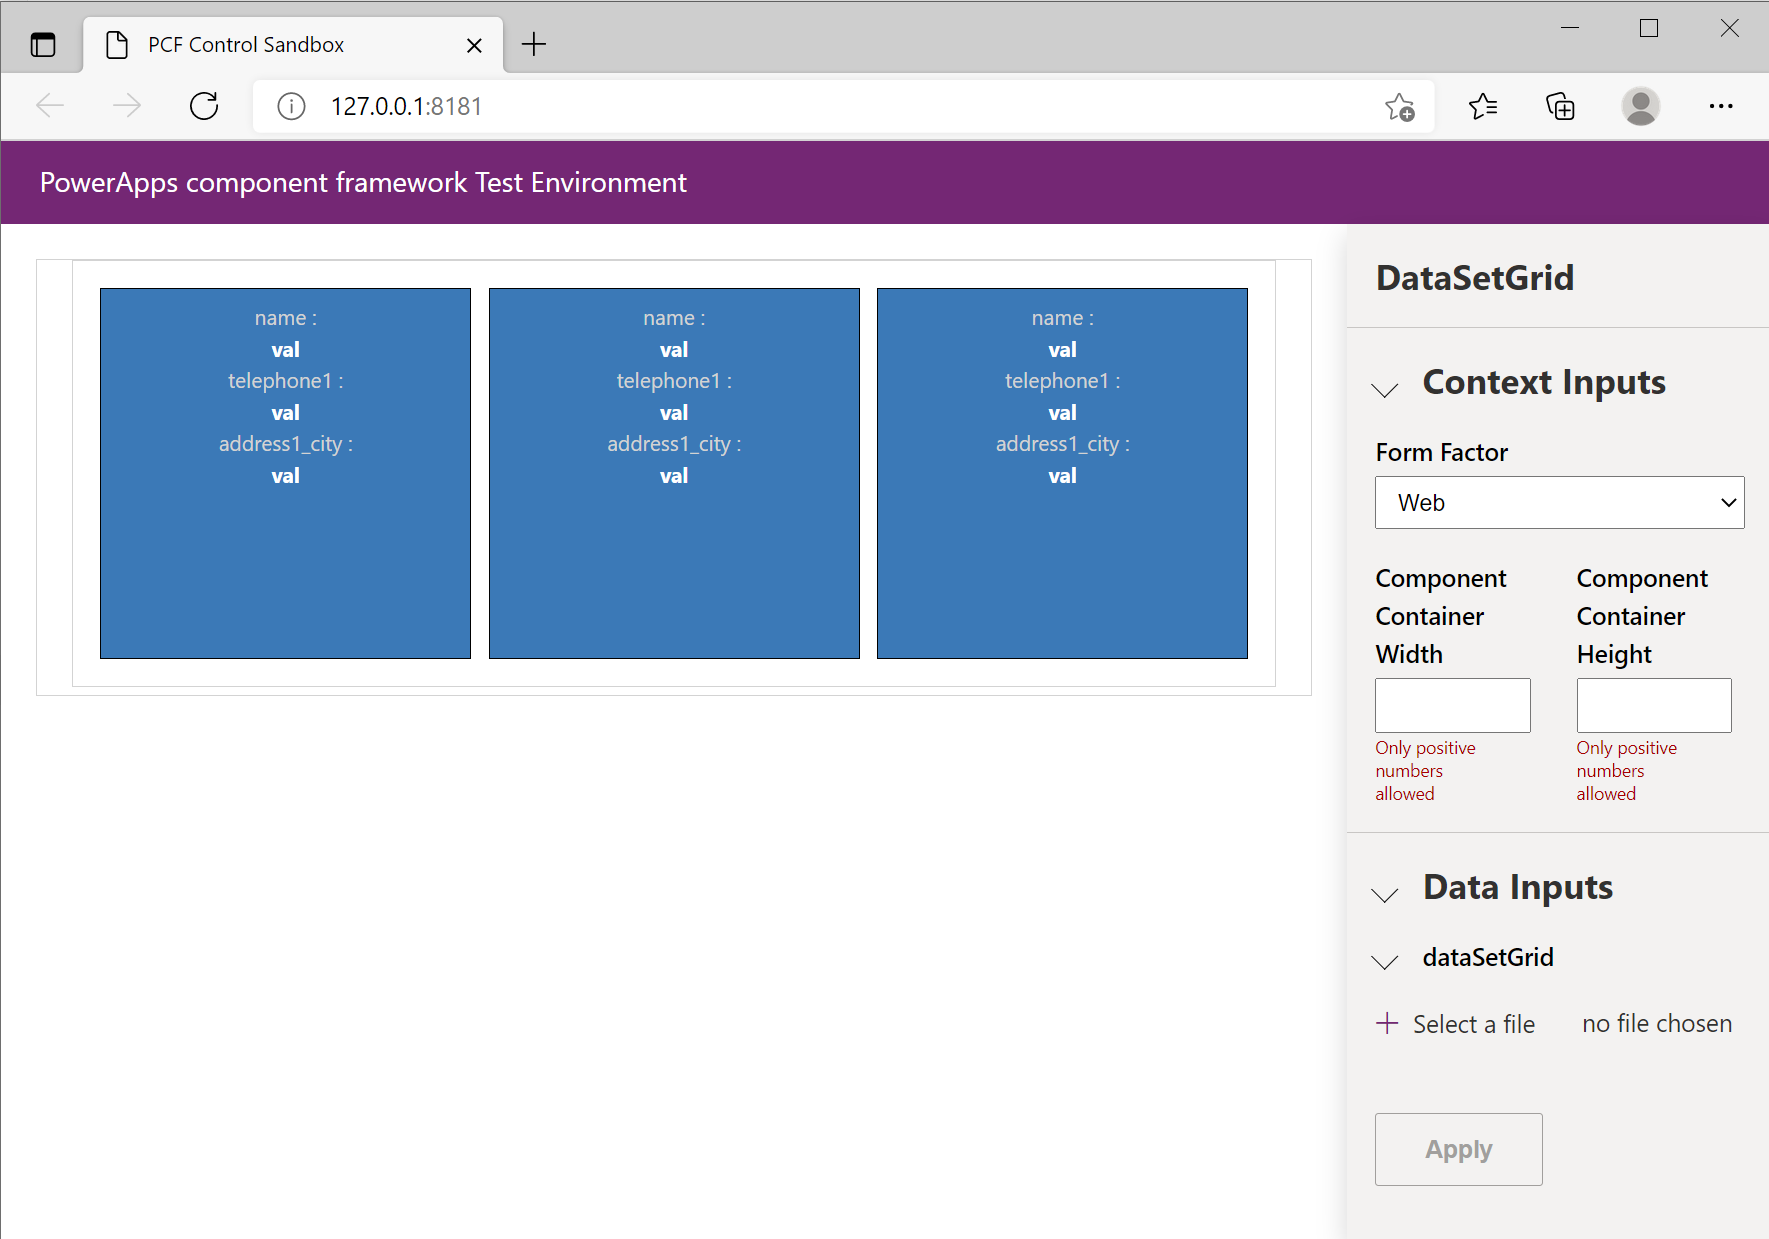
As the image above shows, the browser window opens to display four areas. The code component is rendered in the left pane while the right pane has three sections that depend on the type of component being debugged:
Context Inputs is shown for all code component types:
- Form Factor: Provides a way to specify the form factor and test the code component with each form factor (web, tablet, phone). Form factor is helpful when the code component changes its layout depending on where the component is loaded. You can detect the form factor in the code using
context.client.getFormFactor(). - Component Container Width & Height: Initially, the width and height are empty. This places your code component inside a container
divthat has no width or height CSS style set. If you provide a width or height, the containerdivhas its dimensions constrained so that you can see how your code component adapts to the space available. You need to carefully test your code components behavior inside Power Apps once deployed since the exact behavior is different to that of the test harness. Additionally, your component needs to make a call tocontext.mode.trackContainerResize(true)if it wants to receivecontext.mode.allocatedHeightcontext.mode.allocatedWidthin theupdateViewmethod, however the test harness always provides the height and width irrespective of this call. More information: trackContainerResize.
Note
When using the test harness,
allocatedWidthandallocatedHeightwill be provided as text rather than numeric values.- Form Factor: Provides a way to specify the form factor and test the code component with each form factor (web, tablet, phone). Form factor is helpful when the code component changes its layout depending on where the component is loaded. You can detect the form factor in the code using
Data Inputs is an interactive UI that displays all the properties and their types or type-groups defined in the manifest file. The contents of this area are dependent on the properties and datasets defined in the
ControlManifest.Input.xmland allows providing mock data for test purposes.Outputs render the output whenever a component's getOutputs method gets called.
Note
If you want to modify the ControlManifest.Input.xml file, you will need to restart the debug process before any additional properties or datasets appear in the inputs section. You can do this by using Ctrl + c on the running process at the command line and then running npm start watch again.
Important
Using npm start and npm start watch builds your code component optimized for development and debugging. This code would not normally be deployed to Microsoft Dataverse. More information: Code Components Application Lifecycle Management.
Test code components with mock data
For components with
propertyelements in theControlManifest.Input.xml, the Data Inputs section shows an input box for each value.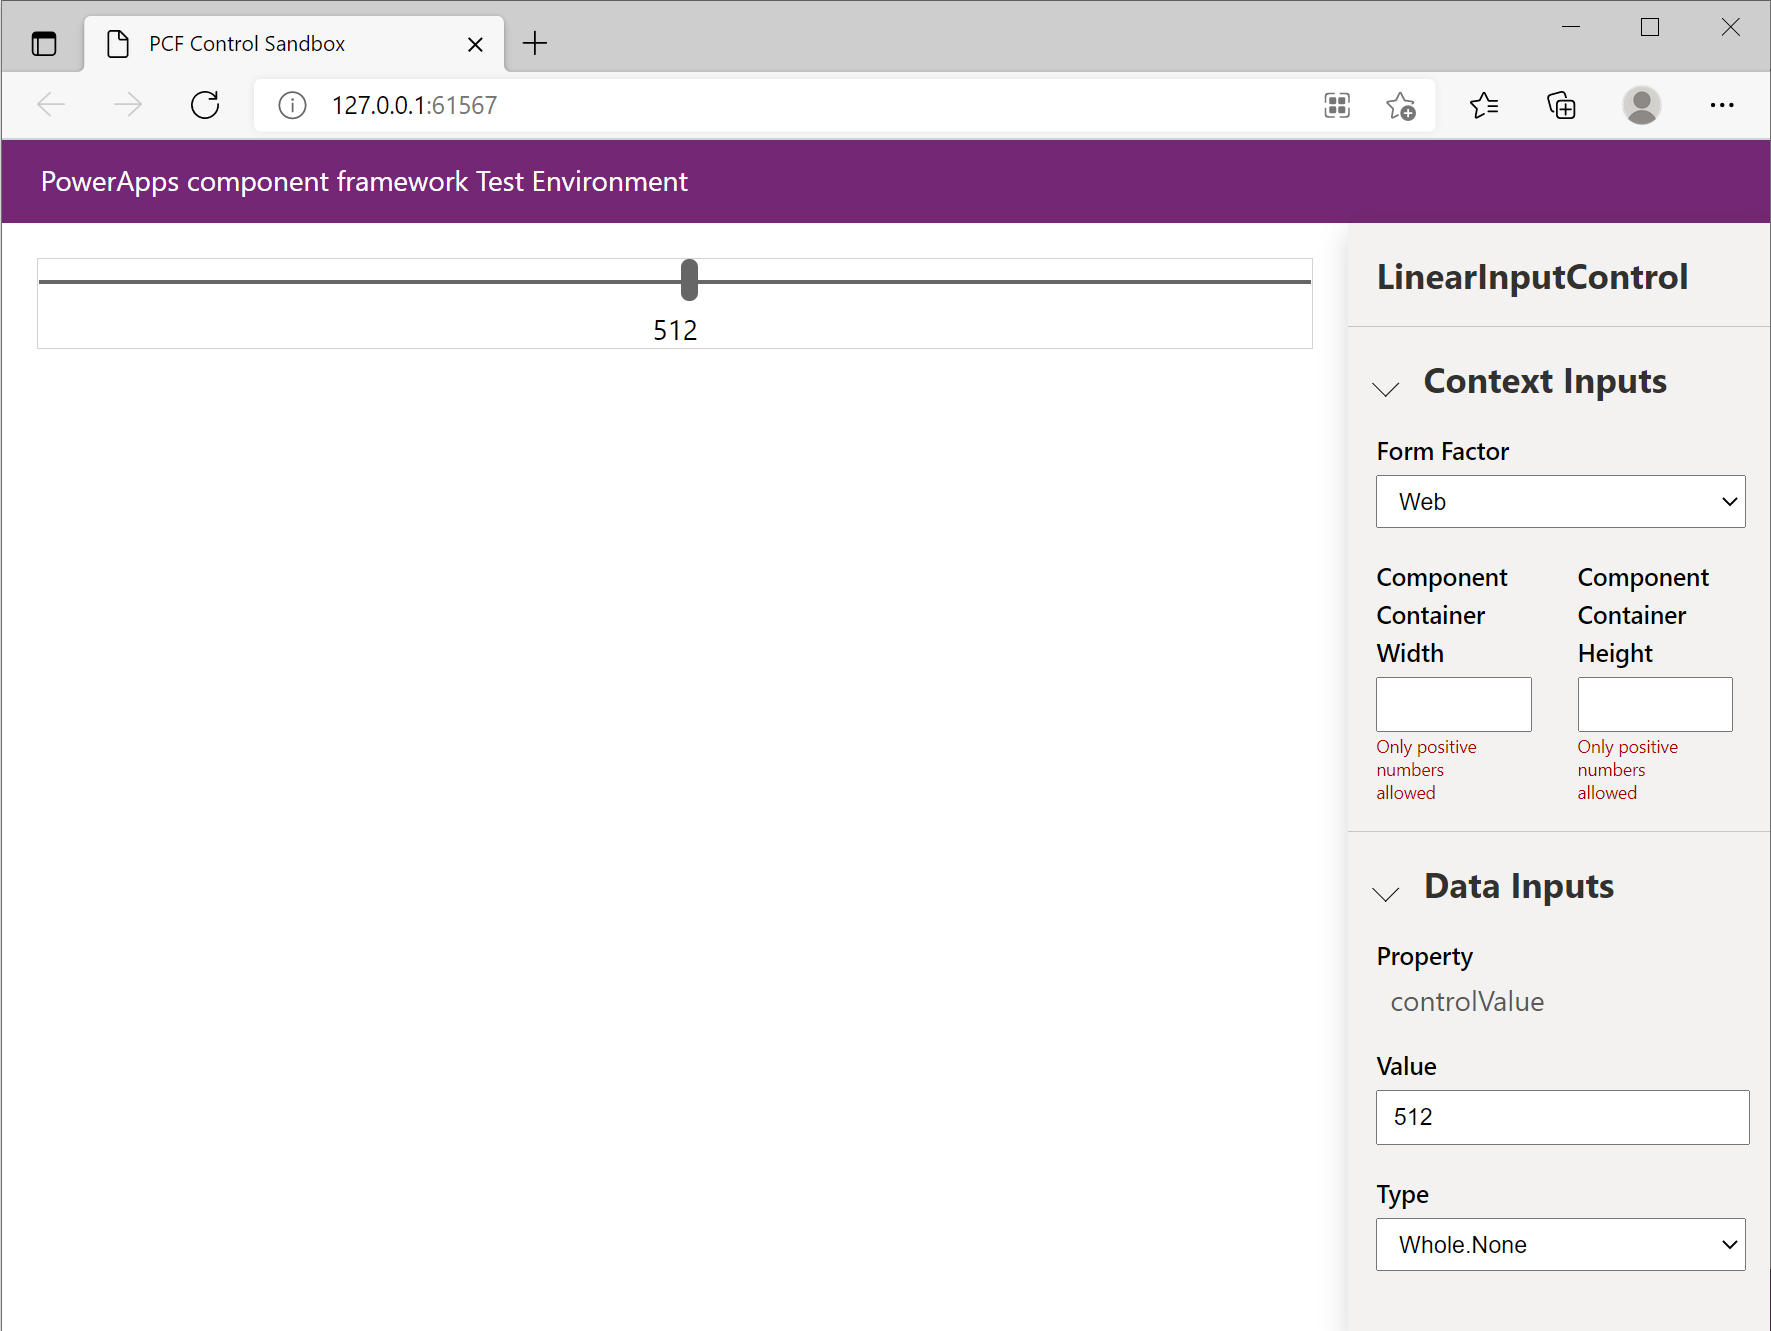
For dataset type components, you can load a CSV file with test data for each data-set element. You manually create or export in .csv format directly from your environment. After loading a CSV file, you can bind each property-set defined in the
ControlManifest.Input.xmlto a column in the CSV file. The following screenshot shows how this binding is done by picking the column for each property: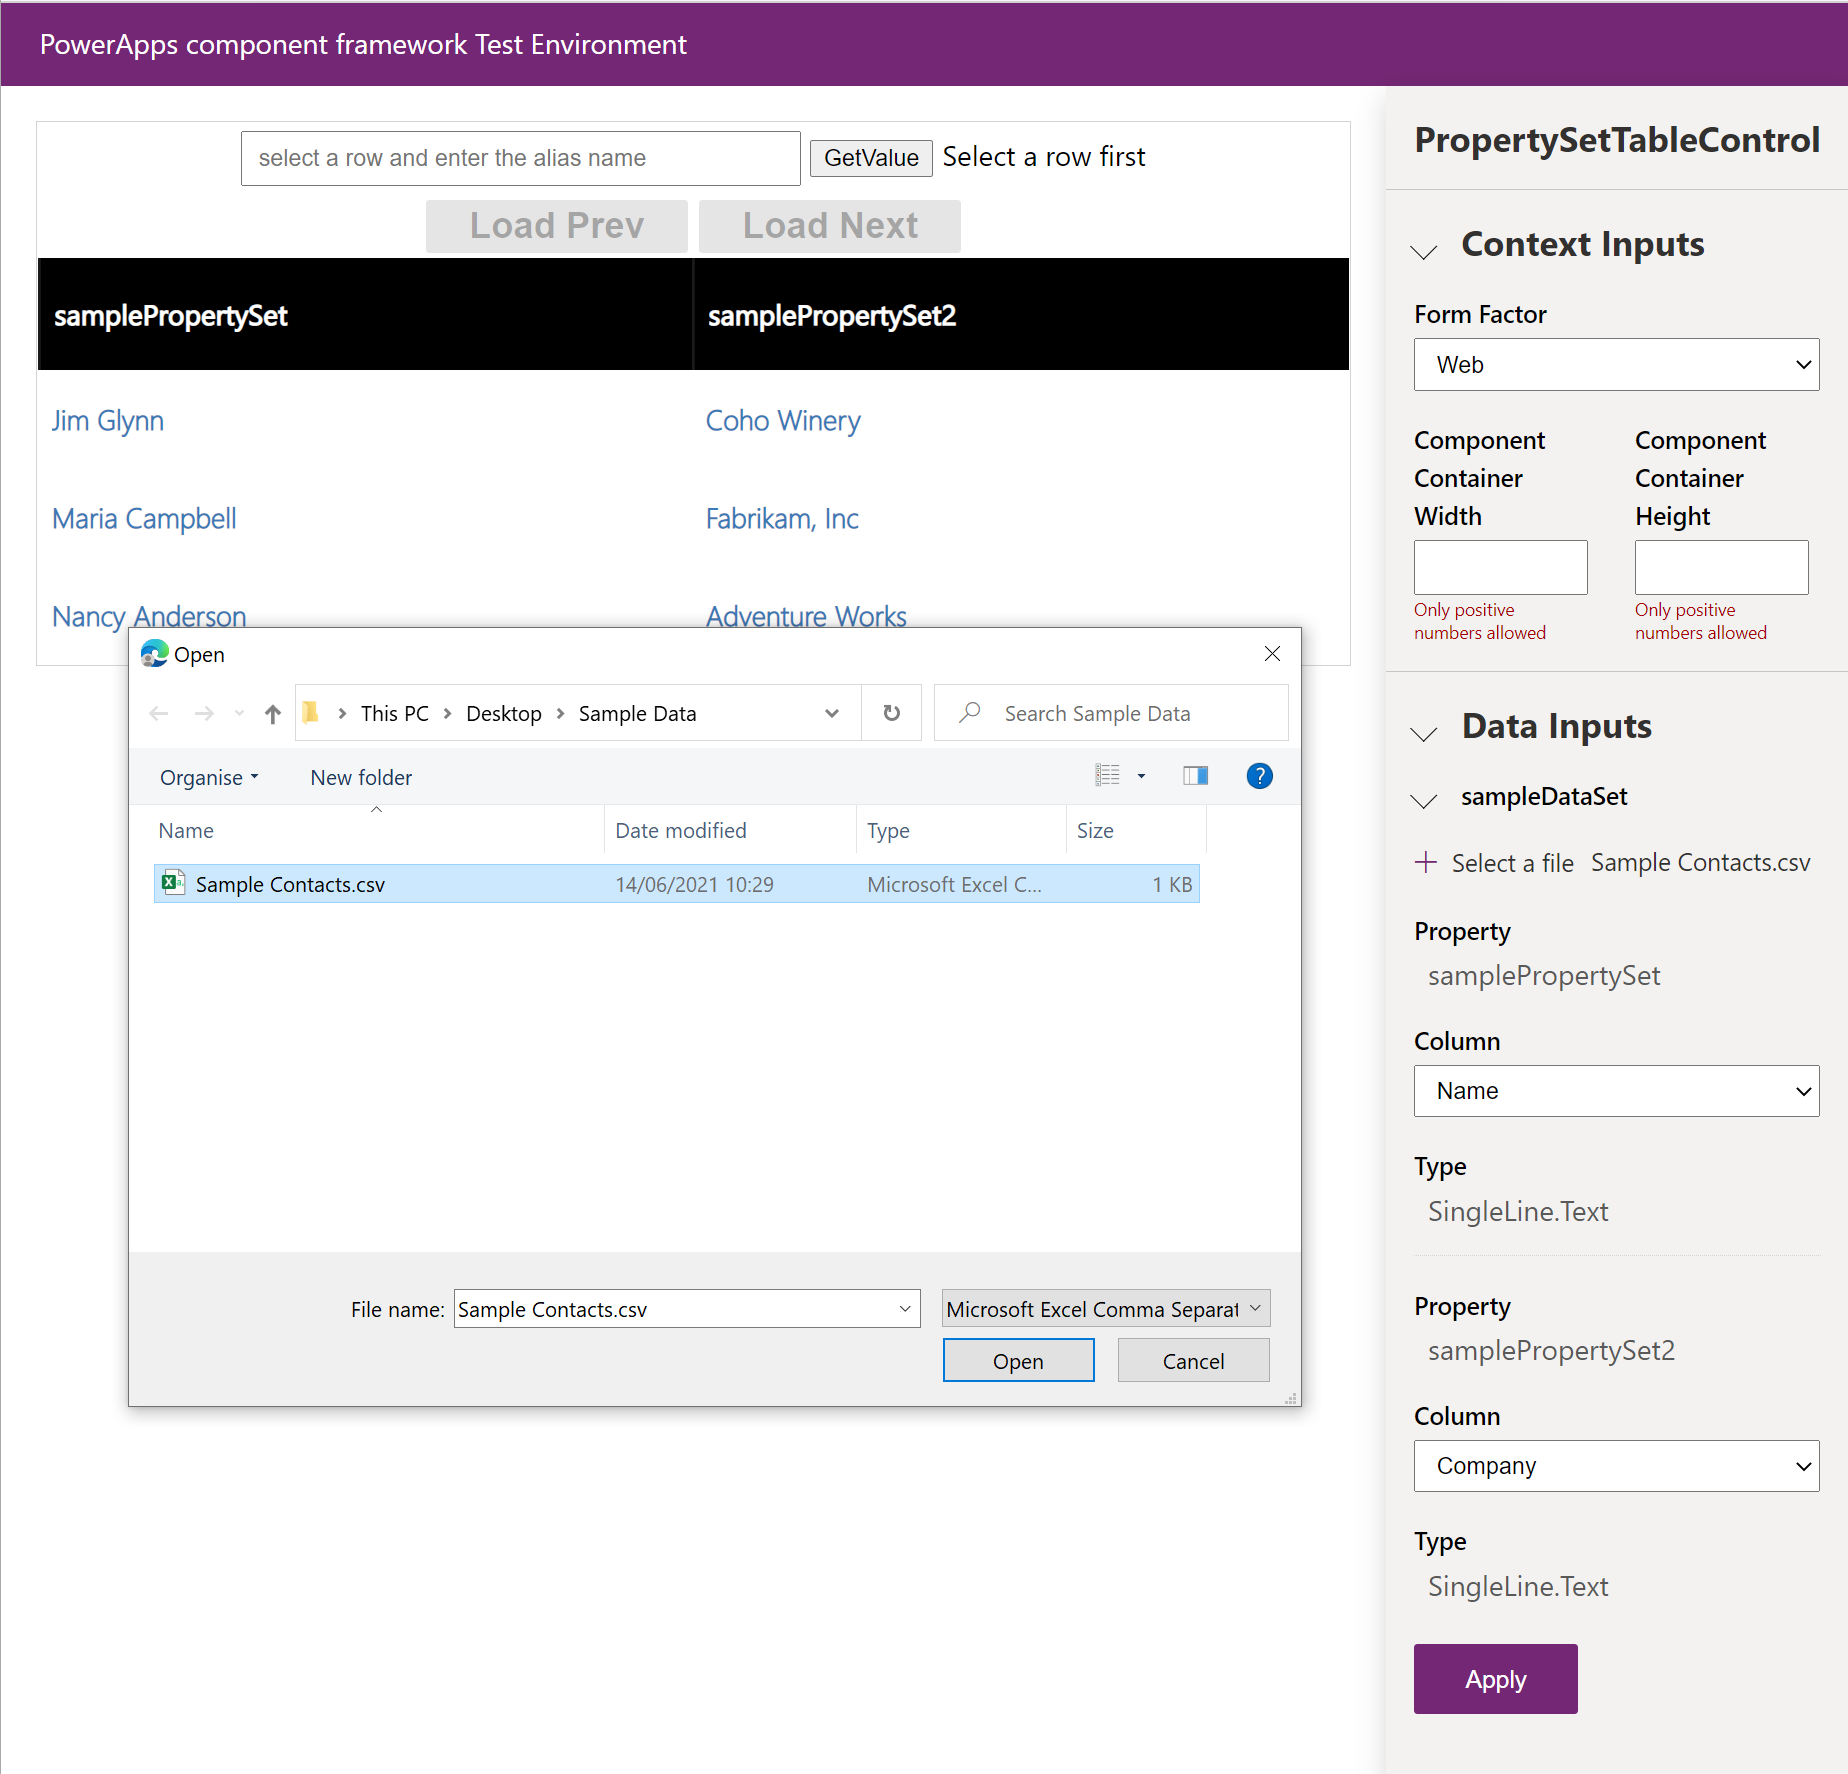
If you don't have any properties defined in the
ControlManifest.Input.xmlfile, then all the columns get automatically loaded into the test harness. The following screenshot shows how you can assign the data type to the code component for each column in the source CSV: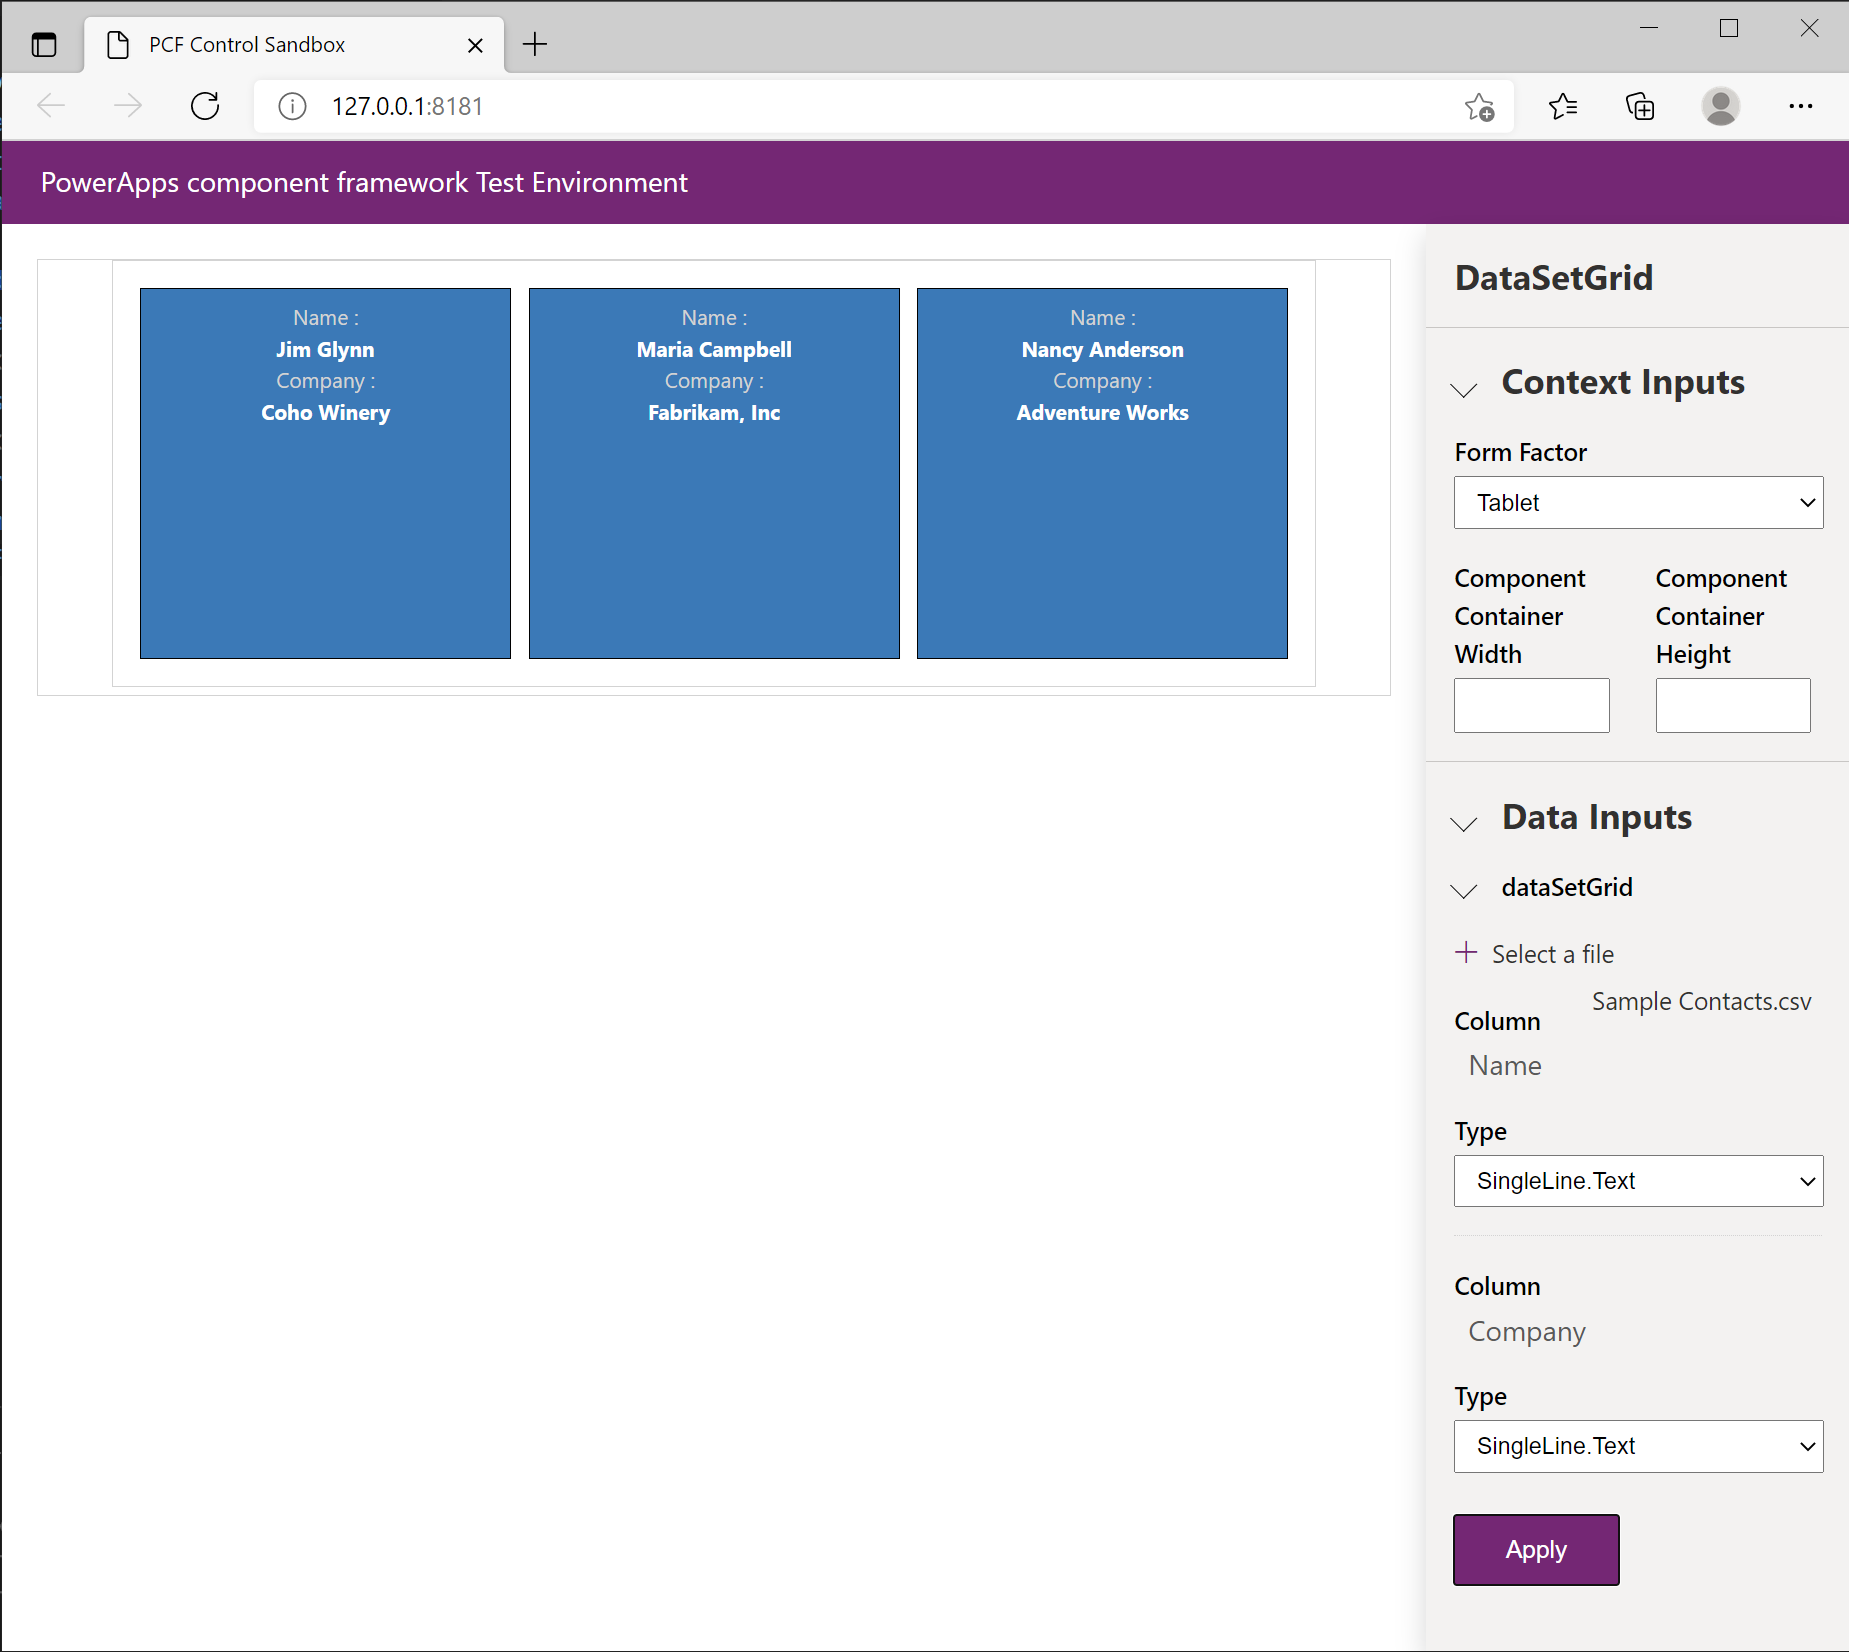
Note
When loading a CSV sample dataset you must select Apply before the data is loaded. If the dataset has property-set elements defined, then each must be mapped to a column in the CSV before you can select Apply. These settings are not remembered and must be set every time a code change is made, after the test harness re-loads.
Common limitations when using the test harness
While the test harness is suitable for testing simple code components, the following scenarios might mean that the test harness can't be used to test a more complex code component:
- The updatedProperties array isn't populated when properties are changed via the test harness Data Inputs section.
- Using features listed in the
feature-usagesection of theControlManifest.Input.xml. For example, calling thecontext.WebApi.*methods throw an exception from within the test harness. - Use of the paging, sorting, and filtering APIs on datasets throw an exception from within the test harness.
- Use of complex datatype bindings that provide more metadata such as choices and lookups. For choice columns, the test harness gives you three simple choices with minimal metadata.
- Model-driven apps specifics such as field level security, read-only behavior, dataset selection API, and integration with the model-driven apps command bar.
- Other context APIs such as Navigation and Utility methods.
To test these scenarios, you need to first deploy your code component and test it by using the technique described in Debug code components after deployment to Microsoft Dataverse
Use browser developer tools to debug code components
Modern browsers have a built-in set of developer tools that allow you to inspect the HTML, CSS, and JavaScript loaded on the current page. You can access these developer tools using the keyboard shortcut Ctrl+Shift+I. Using the F12 key is also a common keyboard shortcut to open the developer tools however this shortcut doesn't work inside Power Apps Studio due to it being already used for the Download App keyboard shortcut.
Bundle code components with webpack
When you write code components using TypeScript, your code probably looks different from the JavaScript that is emitted into the bundled code component output. When you run npm start or npm start watch, the pcf-scripts module (added to the packages.json by running pac pcf init) uses web pack to build multiple TypeScript files into a single bundle.js inside the out folder. This folder also contains any other resources (for example, html/css) referenced by your ControlManifest.Input.xml including the manifest itself, but named instead as just ControlManifest.xml.
When you use modern TypeScript language features such as import/export or async/await that the targeted standard of JavaScript (for example, ES5), doesn't support, the build process transpiles the TypeScript into JavaScript without using these language features. The source maps that are output as part of the development build, provide the information to the developer tools so that breakpoint locations in your TypeScript can be mapped to the corresponding line of JavaScript. Equally, when an exception occurs or you step through the code, you can see the original TypeScript line rather than the underlying transpiled JavaScript.
Another feature of bundling is that when you use npm install to include an external module, the build process adds the required module into your code component's bundle.js using the contents of the associated node_modules directory. For this reason, any external modules used must be packaged in such a way that they can be bundled. More information: Best practices: Module imports.
Note
The source maps will only be output when you run the build-in development mode and will result in a much larger file than your production build. For this reason, it is not recommended to deploy your code component after building for development purposes. More information: Application Lifecycle Management (ALM).
Use developer tools to debug code components
This section describes how to debug your code component inside the Microsoft Edge developer tools:
Load your code component into a browser session using either:
- The test harness using
npm start watch. - A local development build of your code component loaded into a model-driven, canvas app, or portal browser session. You don't need to deploy a development build of your code component to Dataverse server. Instead, you can use Fiddler Auto Responders as described in Debug code components after deployment to Microsoft Dataverse.
- The test harness using
Select
Ctrl+Shift+Ito open the developer tools.Select the Sources tab inside the developer tools panel.
Use
Ctrl+Pto show the Open File command pallet. You can also select Open File from the ellipsis menu.Enter the name of your control (which is the name of the control you used in pac pcf init).
Select the file in the matches listed that is similar to:
webpack://pcf_tools_652ac3f36e1e4bca82eb3c1dc44e6fad/./DataSetGrid/index.ts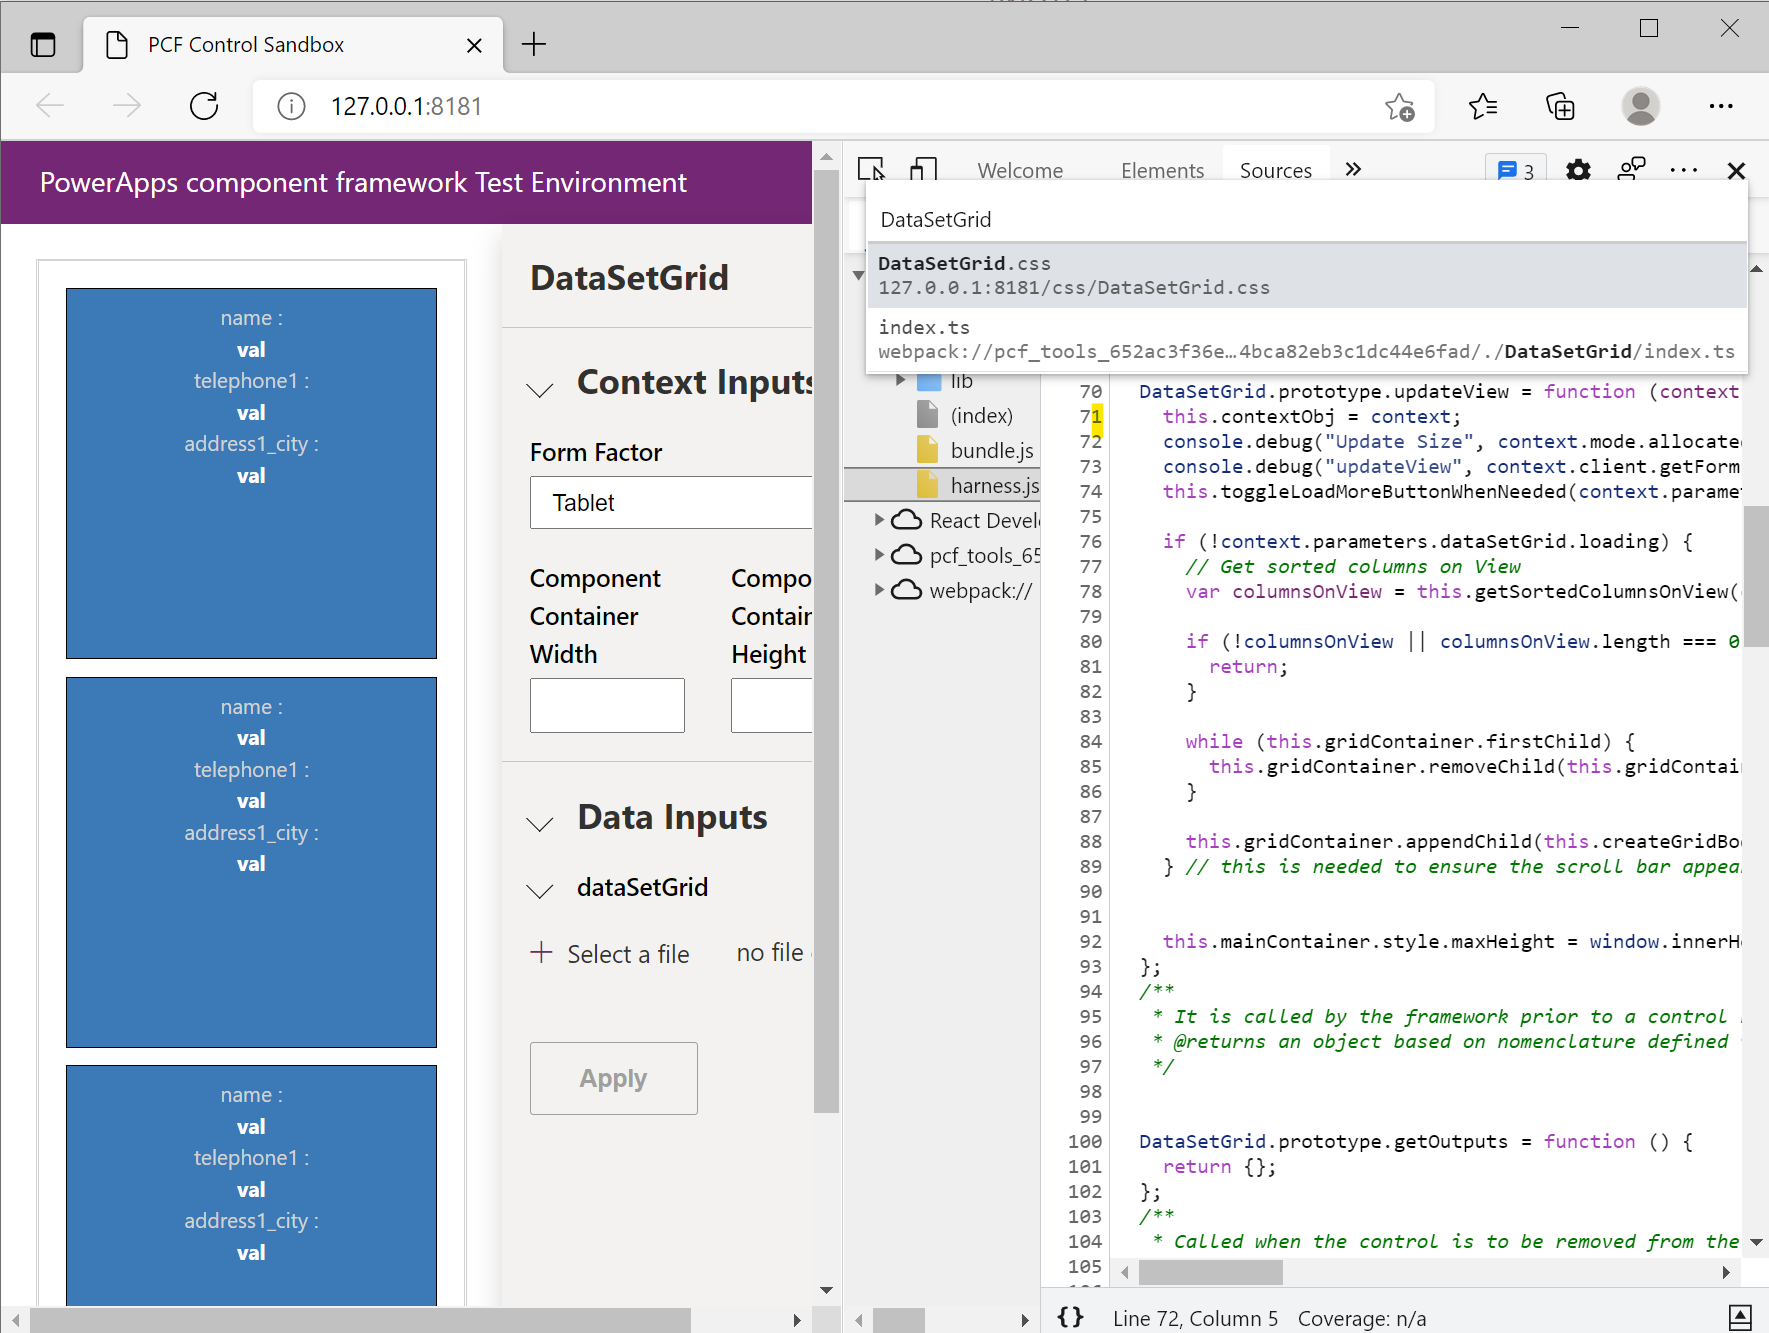
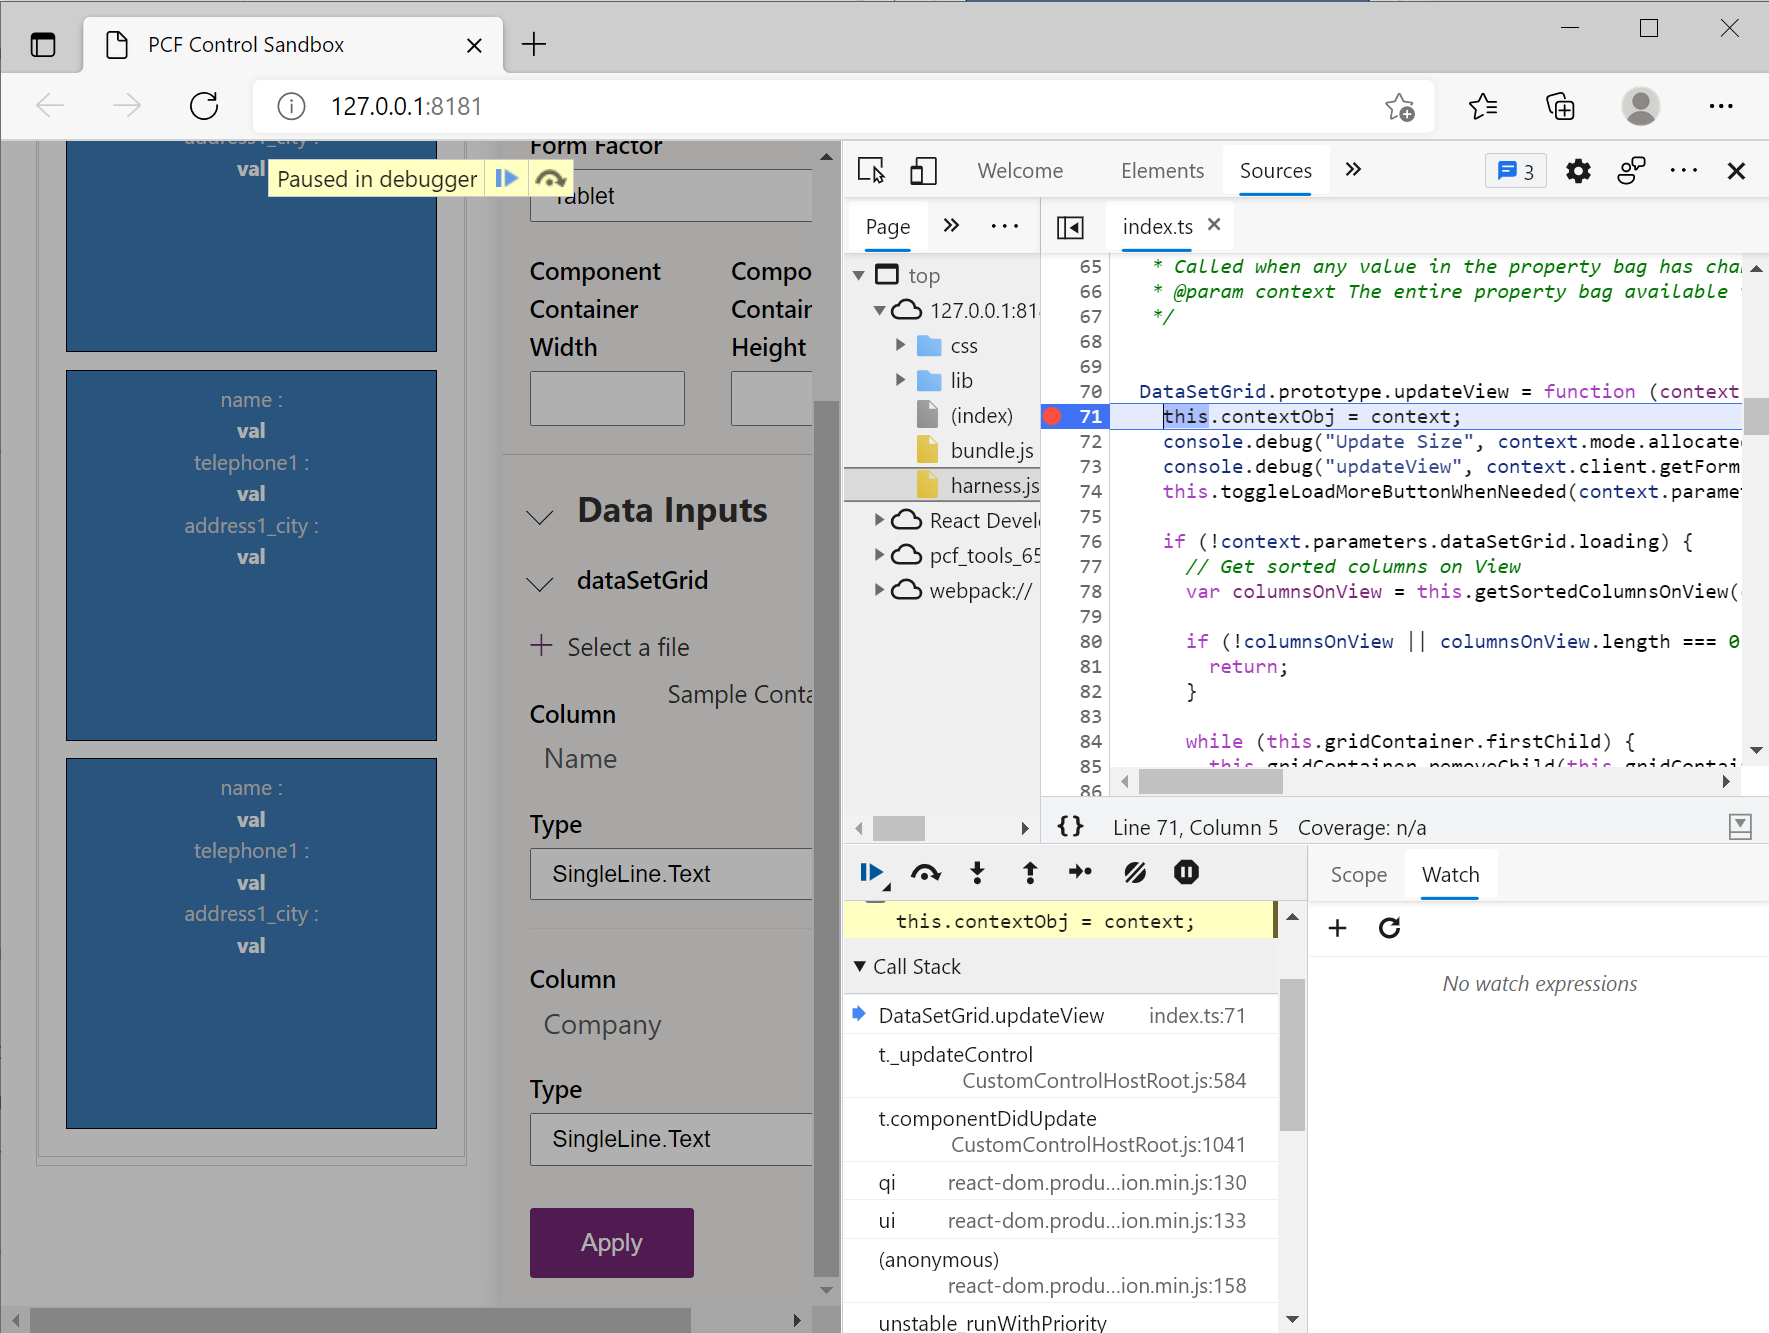
Locate the
updateViewfunction and place a breakpoint on the first line.Make a change to the properties that are bound to your code component. In the test harness, changing properties can be done using the properties panel, or inside Power Apps, you can make a change to a bound property or dataset. Changing properties triggers a call to
updateView.You'll now see your breakpoint hit, and you can inspect the code.
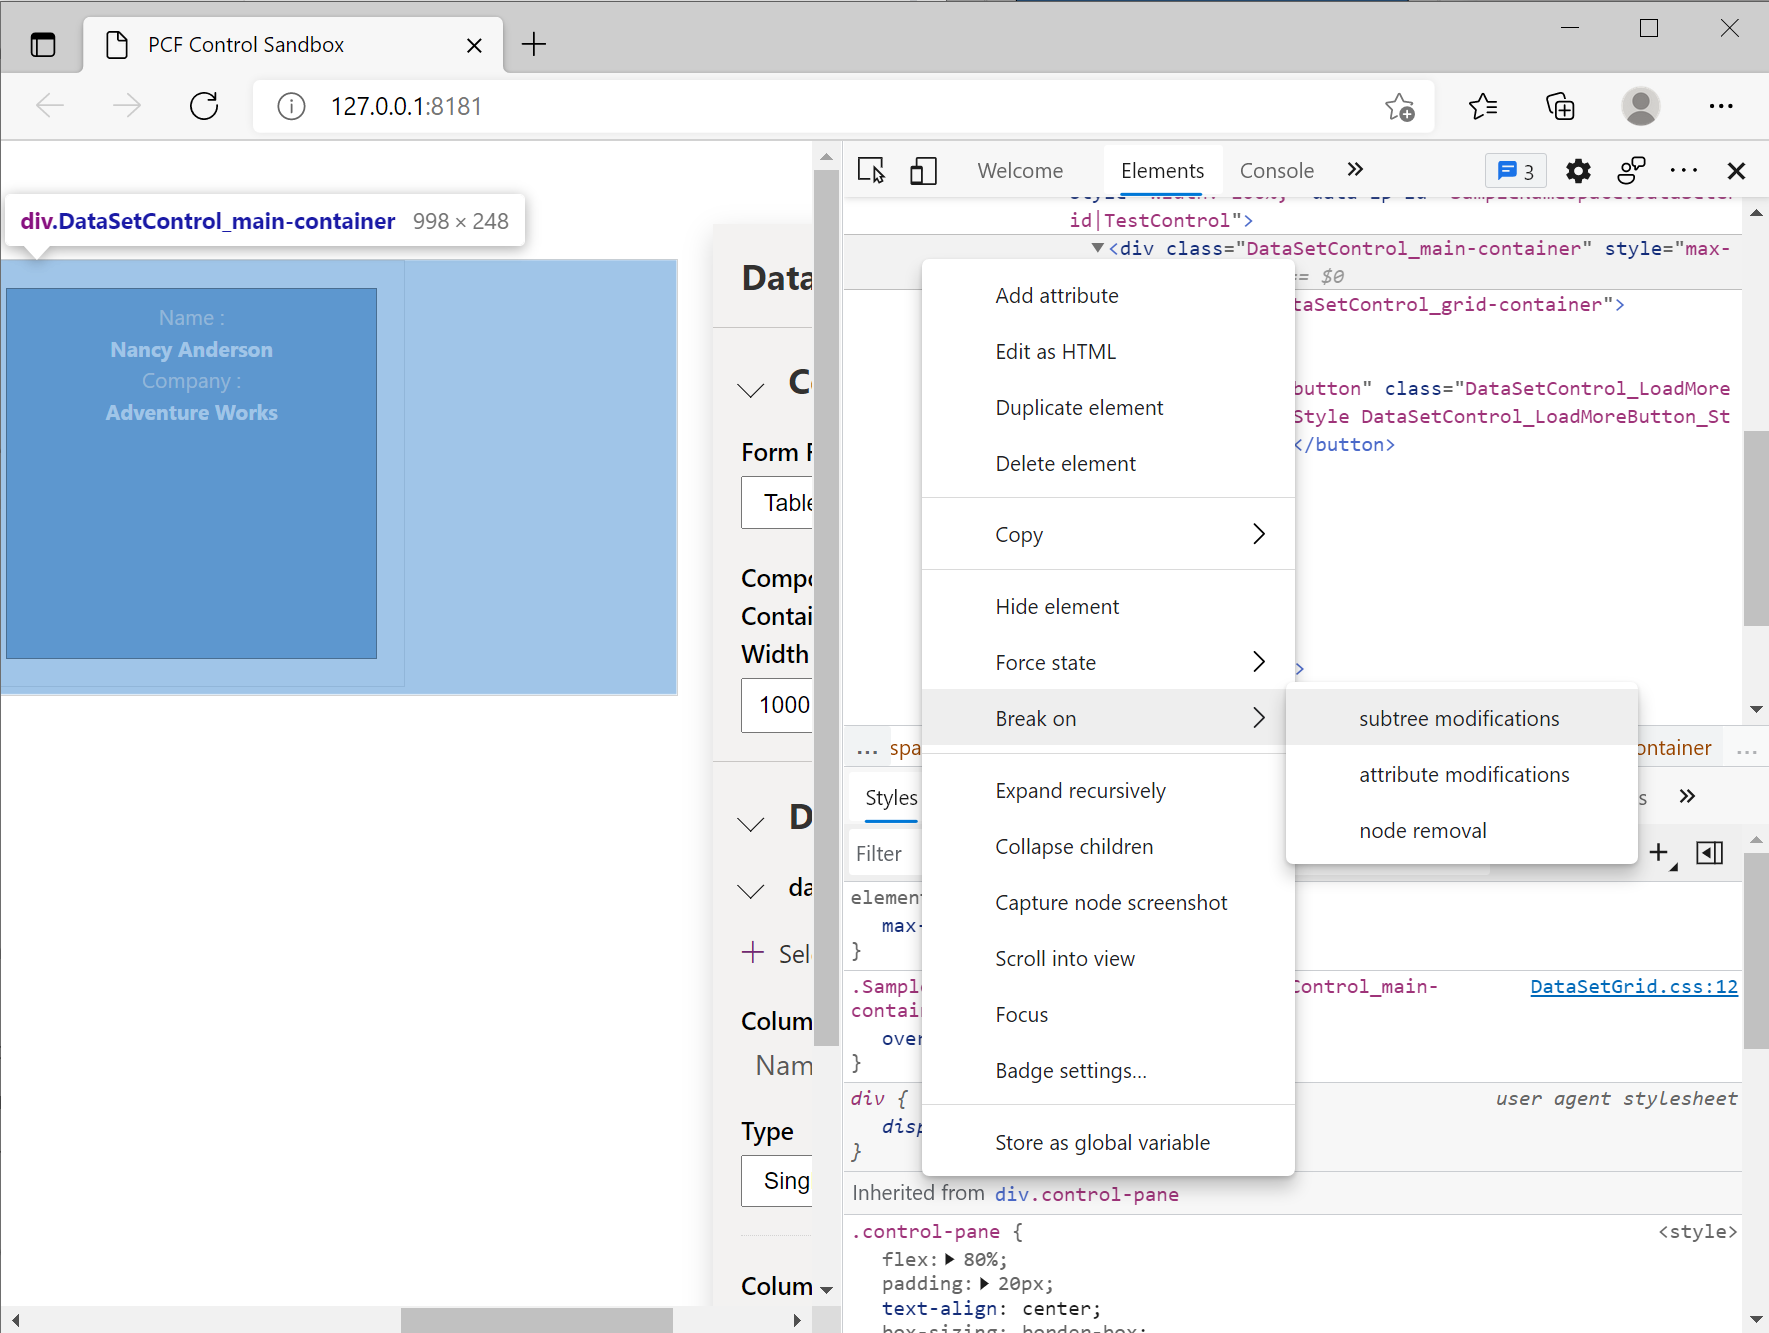
You can also inspect the HTML elements and CSS created by the component using the Elements tab. If you have a specific set of interactions that you're interested in (root container element), you can place a breakpoint on the HTML Dom element using the Context Menu (while the root element is selected) > Break on > subtree modifications
ES5 vs ES6
Currently, by default, code components are configured to transpile into ES5 JavaScript so that older browsers are supported. You can change the target to ES6 if you don't need to support older browsers by setting the target in your projects tsconfig.json to ES6:
{
  "extends": "./node_modules/pcf-scripts/tsconfig_base.json",
  "compilerOptions": {
    "target": "ES6",
    "typeRoots": ["node_modules/@types"]
  }
}
Note
At this time source maps are generated from TypeScript transpiled output for each TypeScript file rather than from the source. If ES5 is targeted, then your source maps will be harder to read due to the ES6 language features (such as classes) being removed. Until support for ES6 is added, even if you need to output ES5, you can update your tsconfig.json to target ES6 while developing so that the source maps are closer to the original TypeScript. If you need to output ES5, remember to set it back before building your code component for production deployment.
Debug code components after deployment to Microsoft Dataverse
To fully test the logic inside the context of a model-driven app, canvas app, or portal you can first deploy and configure your code component to Microsoft Dataverse and then use either Fiddler's Auto Responder feature or use requestly. In both cases, you'll load a development build of your code component (built locally) into the browser without having to continuously deploy changes as you debug your code. Debugging this way allows you to debug against a nondevelopment downstream environment without having to first deploy a development build.
First ensure your component is deployed and configured in Microsoft Dataverse. Ideally, you should only publish production builds of code components into Microsoft Dataverse. For larger code components, publishing a development build might result in the error Web resource size is too large. Since we're going to redirect the code component's bundle.js to a locally built version, you can update your .pcfproj file to always build in production mode when using pac pcf push by setting the property PcfBuildMode to production.
<PropertyGroup>
  <Name>ReactStandardControl</Name>
  <ProjectGuid>0df84c56-2f55-4a80-ac9f-85b7a14bf378</ProjectGuid>
  <OutputPath>$(MSBuildThisFileDirectory)out\controls</OutputPath>
  <PcfBuildMode>production</PcfBuildMode>
</PropertyGroup>
Use Fiddler to debug code components
To debug your code component using Fiddler:
Download and install Fiddler Classic
Open Fiddler and from the menu bar, go to Tools, and then select Options.
Select the HTTPS tab in the dialog box and check the Capture HTTPS CONNECTS and Decrypt HTTPS traffic checkboxes so that the HTTPS traffic is captured and then decrypted.
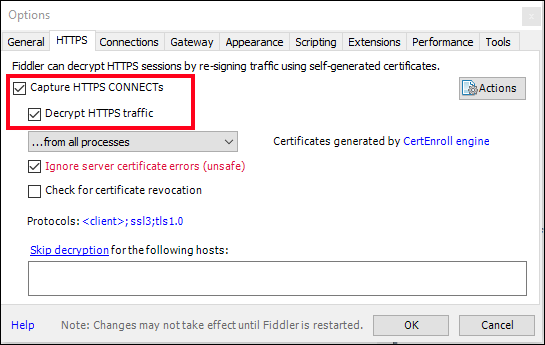
Select OK to close the dialog box.
Note
- If it is the first time you are enabling this setting, Fiddler will prompt you to install a certificate. Install the certificate and restart Fiddler so that the new settings take effect.
- If you have run Fiddler in the past and get a
NET::ERR_CERT_AUTHORITY_INVALIDerror, in the HTTPS tab, select the Actions button and choose Reset All Certificates. This will also present multiple prompts for the new certificates to be installed.
In the right-hand panel, select the AutoResponder tab.
Ensure that Enable Rules and Unmatched requests passthrough are checked.
Select Add Rule and enter first:
REGEX:(.*?)((?'folder'css|html)(%252f|\/))?YOUR_NAMESPACE\.YOUR_CONTROL_NAME[\.\/](?'fname'[^?]*\.*)(.*?)$where:
- YOUR_NAMESPACE - the namespace you provided to pac pcf init as contained in the
control.namespaceattribute of theControlManifest.Input.xml - YOUR_CONTROL_NAME - the component name you provided to pac pcf init and set in the
control.constructorattribute of theControlManifest.Input.xml
This rule aims to match requests for the code component's
bundle.jsand related resources (css/html) in such a way that it works for both model-driven, and canvas apps, both in Power Apps Studio and Player.An example of this rule looks like the following:
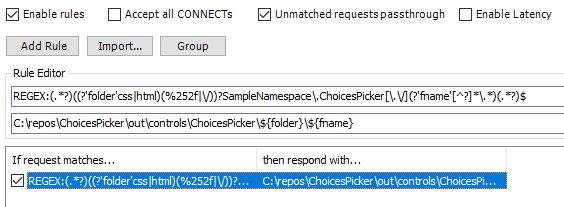
If you want a simpler AutoResponder rule approach, see Script web resource development using Fiddler Auto Responder.
- YOUR_NAMESPACE - the namespace you provided to pac pcf init as contained in the
Enter a string like this for the path to respond with:
C:\COMPONENT_ROOT_FOLDER\out\controls\YOUR_CONTROL_NAME\${folder}\${fname}For example, if your code component root folder is
C:\src\PowerApps-Samples\component-framework\DataSetGridand the component name isDataSetGrid, the path would be:C:\src\PowerApps-Samples\component-framework\DataSetGrid\out\controls\DataSetGrid\${folder}\${fname}Select Save.
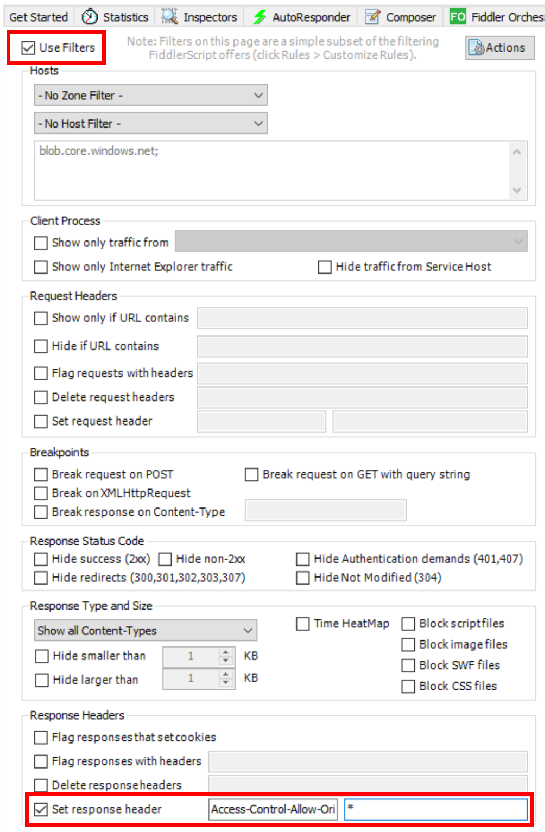
Open the Filters tab and check Use Filters. In the Response Headers section, check Set response header and provide the following:
Header:
Access-Control-Allow-OriginValue:
*
Important
This step is only necessary when debugging code components after they are deployed to canvas apps because the resources are stored in blob storage rather than underneath the
powerapp.comdomain. As such, any requests to these resources will require cross-domain access when loaded by the browser. Only enable thisAccess-Control-Allow-Originfilter rule when you are debugging since it will modify headers of other sites that you visit.Now that you have the AutoResponder rules running you'll need to first clear the cache in the browser and reload the page containing the code component. This can easily be done by opening developer tools (
Ctrl + Shift + I), right-clicking the Refresh > Empty cache and hard refresh.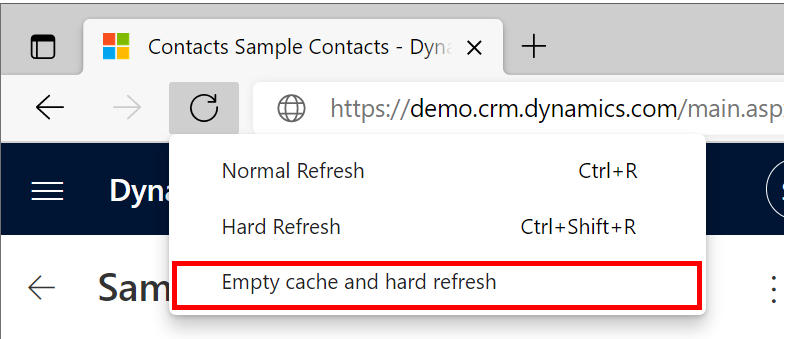
Once you have your code component loaded from your local machine, you can make changes to the code (while
npm start watchis running) and refresh the browser to load the newly built versions. Fiddler's Auto Responder will automatically add a cache-control header so that it will not be cached by the browser so a simple refresh will reload the resources without having to clear the cache each time.
Use Requestly to debug code components
To debug your code component using Requestly:
Enable Internet Information Services (IIS) on your machine.
- Open Control Panel and select Programs and Features > Turn Windows features on or off.
- Enable Internet Information Services.
- Expand the Internet Information Services and verify that the web server components listed in the next section are enabled.
- Select OK.
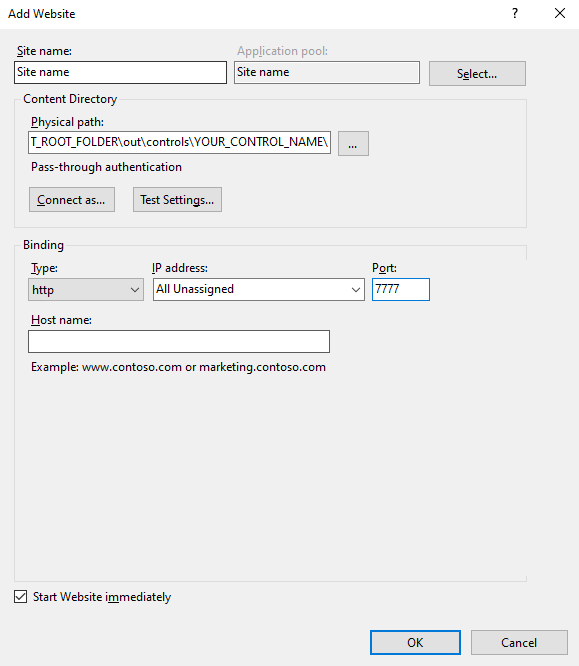
Setup ISS
- Open IIS on your machine.
- In right side panel Connections, expand tree and right-click on Sites.
- Add website.
- Set Site name.
- Set Physical path to your custom component folder, for example,
C:\COMPONENT_ROOT_FOLDER\out\controls\YOUR_CONTROL_NAME\ - Set Port (any number, for instance, 7777).
- Select OK. Selected folder is now hosted on
http://localhost:<SELECTED_PORT>
Download and install Requestly
Follow onboarding to the tool.
Open rules (navigate to https://app.requestly.io/rules).
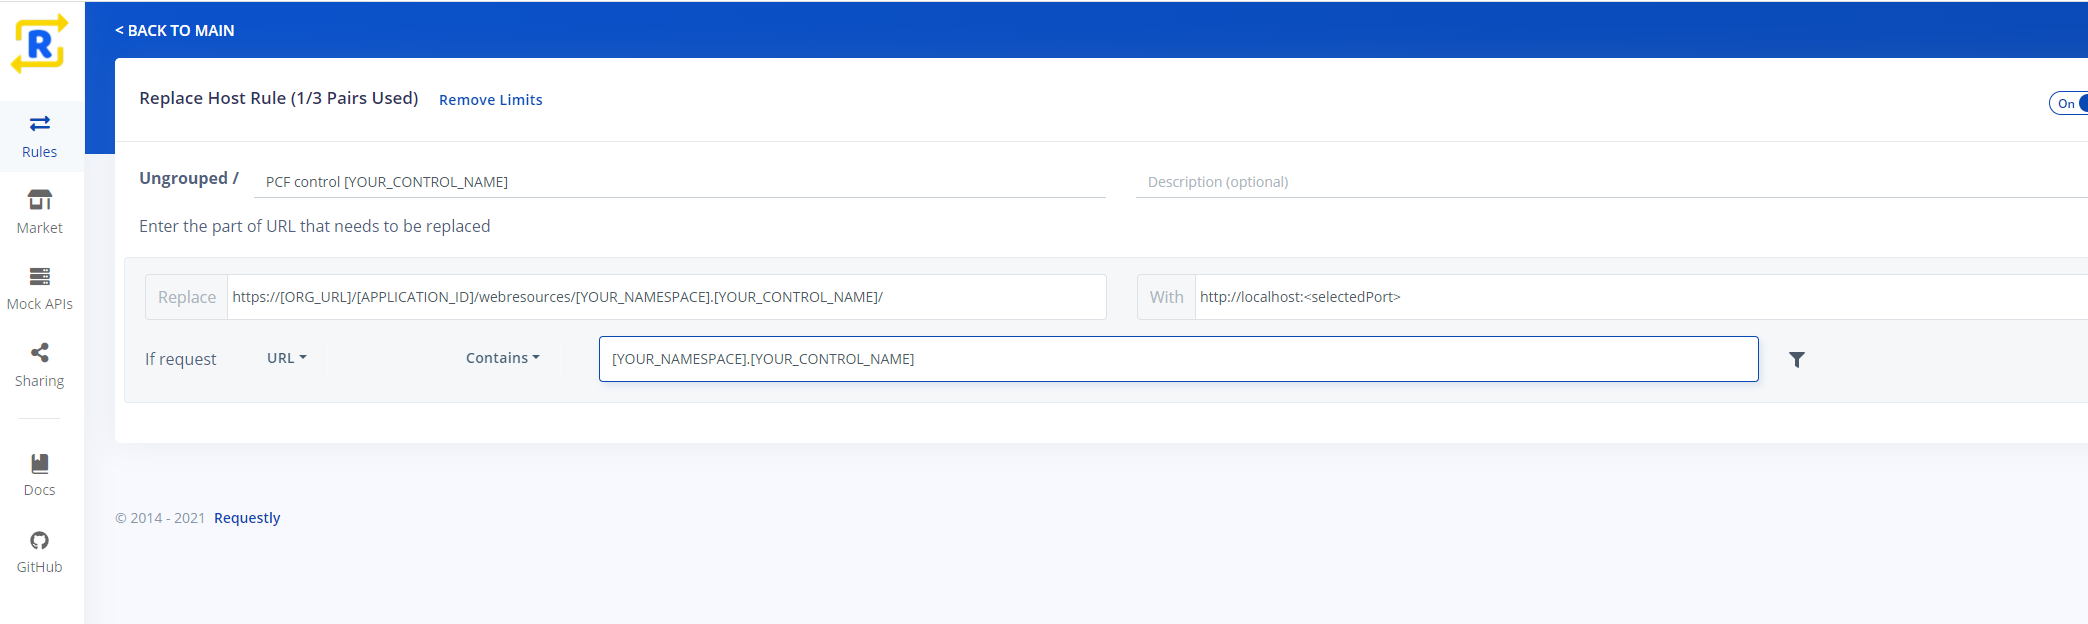
Add "Replace Host" rule:
- Set name of the rule.
- Set "Replace" field with
https://[ORG_URL]/[APPLICATION_ID]/webresources/[YOUR_NAMESPACE].[YOUR_CONTROL_NAME]/ - Set "With" with
http://localhost:<SELECTED_PORT> - Set "If request" with "URL" "Contains"
[YOUR_NAMESPACE].[YOUR_CONTROL_NAME] - Save the rule and enable it.
Now you need to clear the cache in the browser and reload the page containing the code component. You can clear the cache in the browser and reload the page by opening developer tools (
Ctrl + Shift + I), right-clicking the Refresh > Empty cache and hard refresh.
Once you have your code component loaded from your local machine, you can make changes to the code (while
npm start watchis running) and refresh the browser to load the newly built versions. Requestly automatically adds a cache-control header so that it isn't cached by the browser so a simple refresh will reload the resources without having to clear the cache each time.
Related articles
Power Apps component framework API reference
Power Apps component framework overview
Application Lifecycle Management (ALM)
Create your first component