' cx='32' cy='32' r='32' /%3E%3Ctext x='50%25' y='55%25' dominant-baseline='middle' text-anchor='middle' fill='%23FFF' %3EHO%3C/text%3E%3C/svg%3E)
' cx='32' cy='32' r='32' /%3E%3Ctext x='50%25' y='55%25' dominant-baseline='middle' text-anchor='middle' fill='%23FFF' %3EMP%3C/text%3E%3C/svg%3E)
Refer to https://learn.microsoft.com/en-us/windows/client-management/mdm-collect-logs
Download the MDM Diagnostic Information log from Windows devices
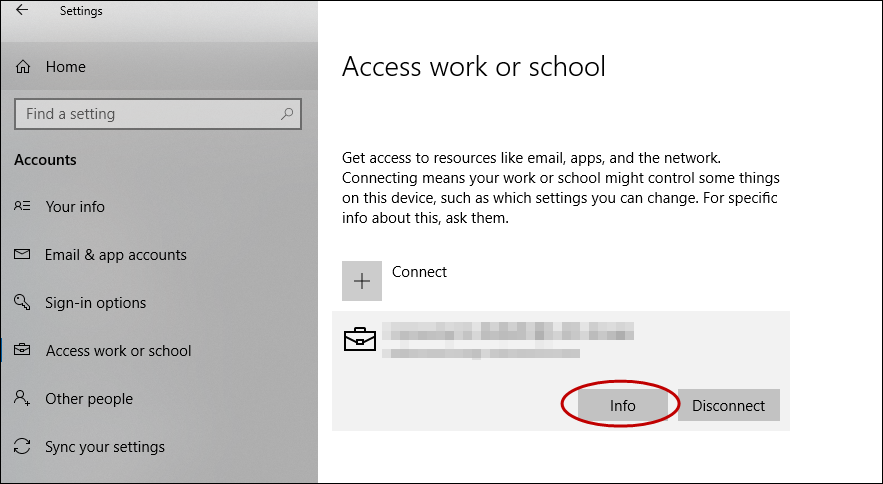
On your managed device, go to Settings > Accounts > Access work or school.
Select your work or school account, then select Info.
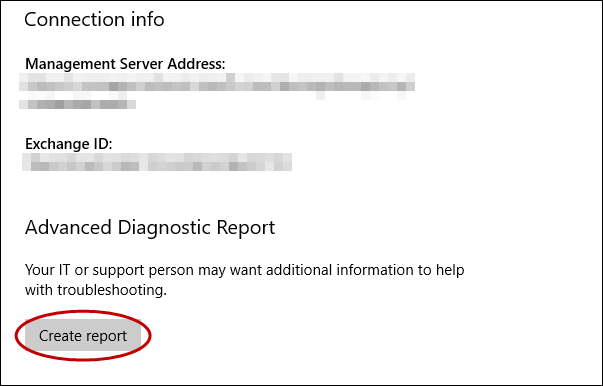
At the bottom of the Settings page, select Create report.
A window opens that shows the path to the log files. Select Export.
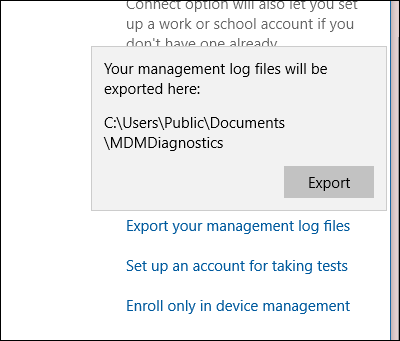
In File Explorer, navigate to C:\Users\Public\Documents\MDMDiagnostics to see the report.
Use command to collect logs directly from Windows devices
You can also collect the MDM Diagnostic Information logs using the following command:
XML
mdmdiagnosticstool.exe -area "DeviceEnrollment;DeviceProvisioning;Autopilot" -zip "c:\users\public\documents\MDMDiagReport.zip"
- In File Explorer, navigate to c:\Users\Public\Documents\MDMDiagnostics to see the report.
Understanding zip structure
The zip file has logs according to the areas that were used in the command. This explanation is based on DeviceEnrollment, DeviceProvisioning, and Autopilot areas. It applies to the zip files collected via command line or Feedback Hub
- DiagnosticLogCSP_Collector_Autopilot_*: Autopilot etls
- DiagnosticLogCSP_Collector_DeviceProvisioning_*: Provisioning etls (Microsoft-Windows-Provisioning-Diagnostics-Provider)
- MDMDiagHtmlReport.html: Summary snapshot of MDM configurations and policies. Includes, management url, MDM server device ID, certificates, policies.
- MdmDiagLogMetadata.json: mdmdiagnosticstool metadata file that contains command-line arguments used to run the tool.
- MDMDiagReport.xml: contains a more detailed view into the MDM configurations, such as enrollment variables, provisioning packages, multivariant conditions, and others. For more information about diagnosing provisioning packages, see Diagnose provisioning packages.
- MdmDiagReport_RegistryDump.reg: contains dumps from common MDM registry locations
- MdmLogCollectorFootPrint.txt: mdmdiagnosticslog tool logs from running the command
- *.evtx: Common event viewer logs microsoft-windows-devicemanagement-enterprise-diagnostics-provider-admin.evtx main one that contains MDM events.
Collect logs directly from Windows devices
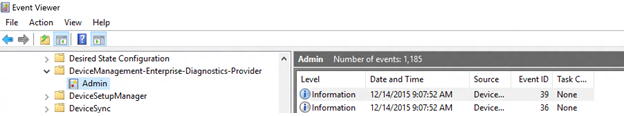
MDM logs are captured in the Event Viewer in the following location:
- Applications and Services Logs > Microsoft > Windows > DeviceManagement-Enterprise-Diagnostic-Provider
Here's a screenshot:
In this location, the Admin channel logs events by default. However, if you need more details logs you can enable Debug logs by choosing Show Analytic and Debug logs option in View menu in Event Viewer.
Collect admin logs
- Right-click the Admin node.
- Select Save all events as.
- Choose a location and enter a filename.
- Select Save.
- Choose Display information for these languages and then select English.
- Select Ok.
For more detailed logging, you can enable Debug logs. Right-click on the Debug node and then select Enable Log.
Collect debug logs
- Right-click on the Debug node.
- Select Save all events as.
- Choose a location and enter a filename.
- Select Save.
- Choose Display information for these languages and then select English.
- Select Ok.
You can open the log files (.evtx files) in the Event Viewer on a Windows device.
Collect logs remotely from Windows devices
When the PC is already enrolled in MDM, you can remotely collect logs from the PC through the MDM channel if your MDM server supports this facility. The DiagnosticLog CSP can be used to enable an event viewer channel by full name. Here are the Event Viewer names for the Admin and Debug channels:
- Microsoft-Windows-DeviceManagement-Enterprise-Diagnostics-Provider%2FAdmin
- Microsoft-Windows-DeviceManagement-Enterprise-Diagnostics-Provider%2FDebug
If the above response helps answer your question, remember to "Accept Answer" so that others in the community facing similar issues can easily find the solution. Your contribution is highly appreciated.
hth
Marcin
' cx='32' cy='32' r='32' /%3E%3Ctext x='50%25' y='55%25' dominant-baseline='middle' text-anchor='middle' fill='%23FFF' %3EDV%3C/text%3E%3C/svg%3E)