Note
Access to this page requires authorization. You can try signing in or changing directories.
Access to this page requires authorization. You can try changing directories.
In this quickstart, you use graph in Microsoft Fabric to create a basic graph with two nodes and one edge, and then run a query. This process takes about 15 minutes.
For a comprehensive tutorial that covers the full Adventure Works data model and more advanced scenarios, see the graph tutorial.
Prerequisites
Before you start this quickstart, verify that:
You have access to a Microsoft Fabric capacity (F2 or higher) or a Fabric trial.
You're a member of a Fabric workspace or have permission to create items in the workspace. For more information, see Workspaces in Microsoft Fabric.
Important
Access management of the graph is restricted to the workspace that hosts it. Users outside of the workspace can't access the graph. Users within the workspace who have access to the underlying data in the lakehouse can model and query the graph.
Load sample data
To create your graph, first load sample data into a lakehouse in your Fabric workspace.
Download the sample data
Go to the graph in Microsoft Fabric GQL example datasets on GitHub.
Select the adventureworks_docs_sample.zip file and download it to your local machine.
Tip
To download a file from GitHub, select the file, and then select the Download raw file icon.
Extract the downloaded adventureworks_docs_sample.zip file to a folder on your local machine.
Tip
In File Explorer, right-click the zip file and select Extract All, then choose a destination folder.
Create a lakehouse
- In Microsoft Fabric, select the workspace where you want to create the lakehouse.
- Select + New item.
- Select Store data > Lakehouse.
- Enter a name (for example, "AdventureWorksLakehouse"), clear the Lakehouse schemas option, and select Create.
Load the data into tables
For this quickstart, you only need two tables: adventureworks_customers and adventureworks_orders. Upload the full sample data folder, and then load just these two tables.
Note
The full set of sample files is used in the full graph tutorial. You can also use them to explore additional data on your own.
- In your lakehouse, hover over Files, select the ellipsis (...), and then select Upload > Upload folder.
- Browse to the extracted folder and upload it. This action uploads all the sample data files to your lakehouse.
- Expand Files and the uploaded folder to see the subfolders. For this quickstart, you only need to load two of them as tables.
- Hover over the adventureworks_customers subfolder, select the ellipsis (...), and choose Load to Tables > New table.
- Set the file type to parquet and select Load.
- Repeat steps 4-5 for the adventureworks_orders subfolder.
When you finish, you see the two tables under Tables in the lakehouse Explorer panel.

Create a graph model
In your Microsoft Fabric workspace, select + New item.
Enter graph in the search box, press Enter to search for graph items, and select Graph instance. Alternatively, scroll down to Analyze and train data > Graph instance.

Enter a name for your graph model, such as AdventureWorksGraph, and select Create.

After creating the graph model, you're taken to the graph view where you can see the default mode is set to Model. Across the top ribbons, you see buttons for Save, Get data, Add node, Add edge, and Delete.

Add data to your graph
To add data to your graph, follow these steps in graph view:
In the top ribbon, select Get data.
From the OneLake catalog, select your lakehouse with the Adventure Works data.
Select Add.
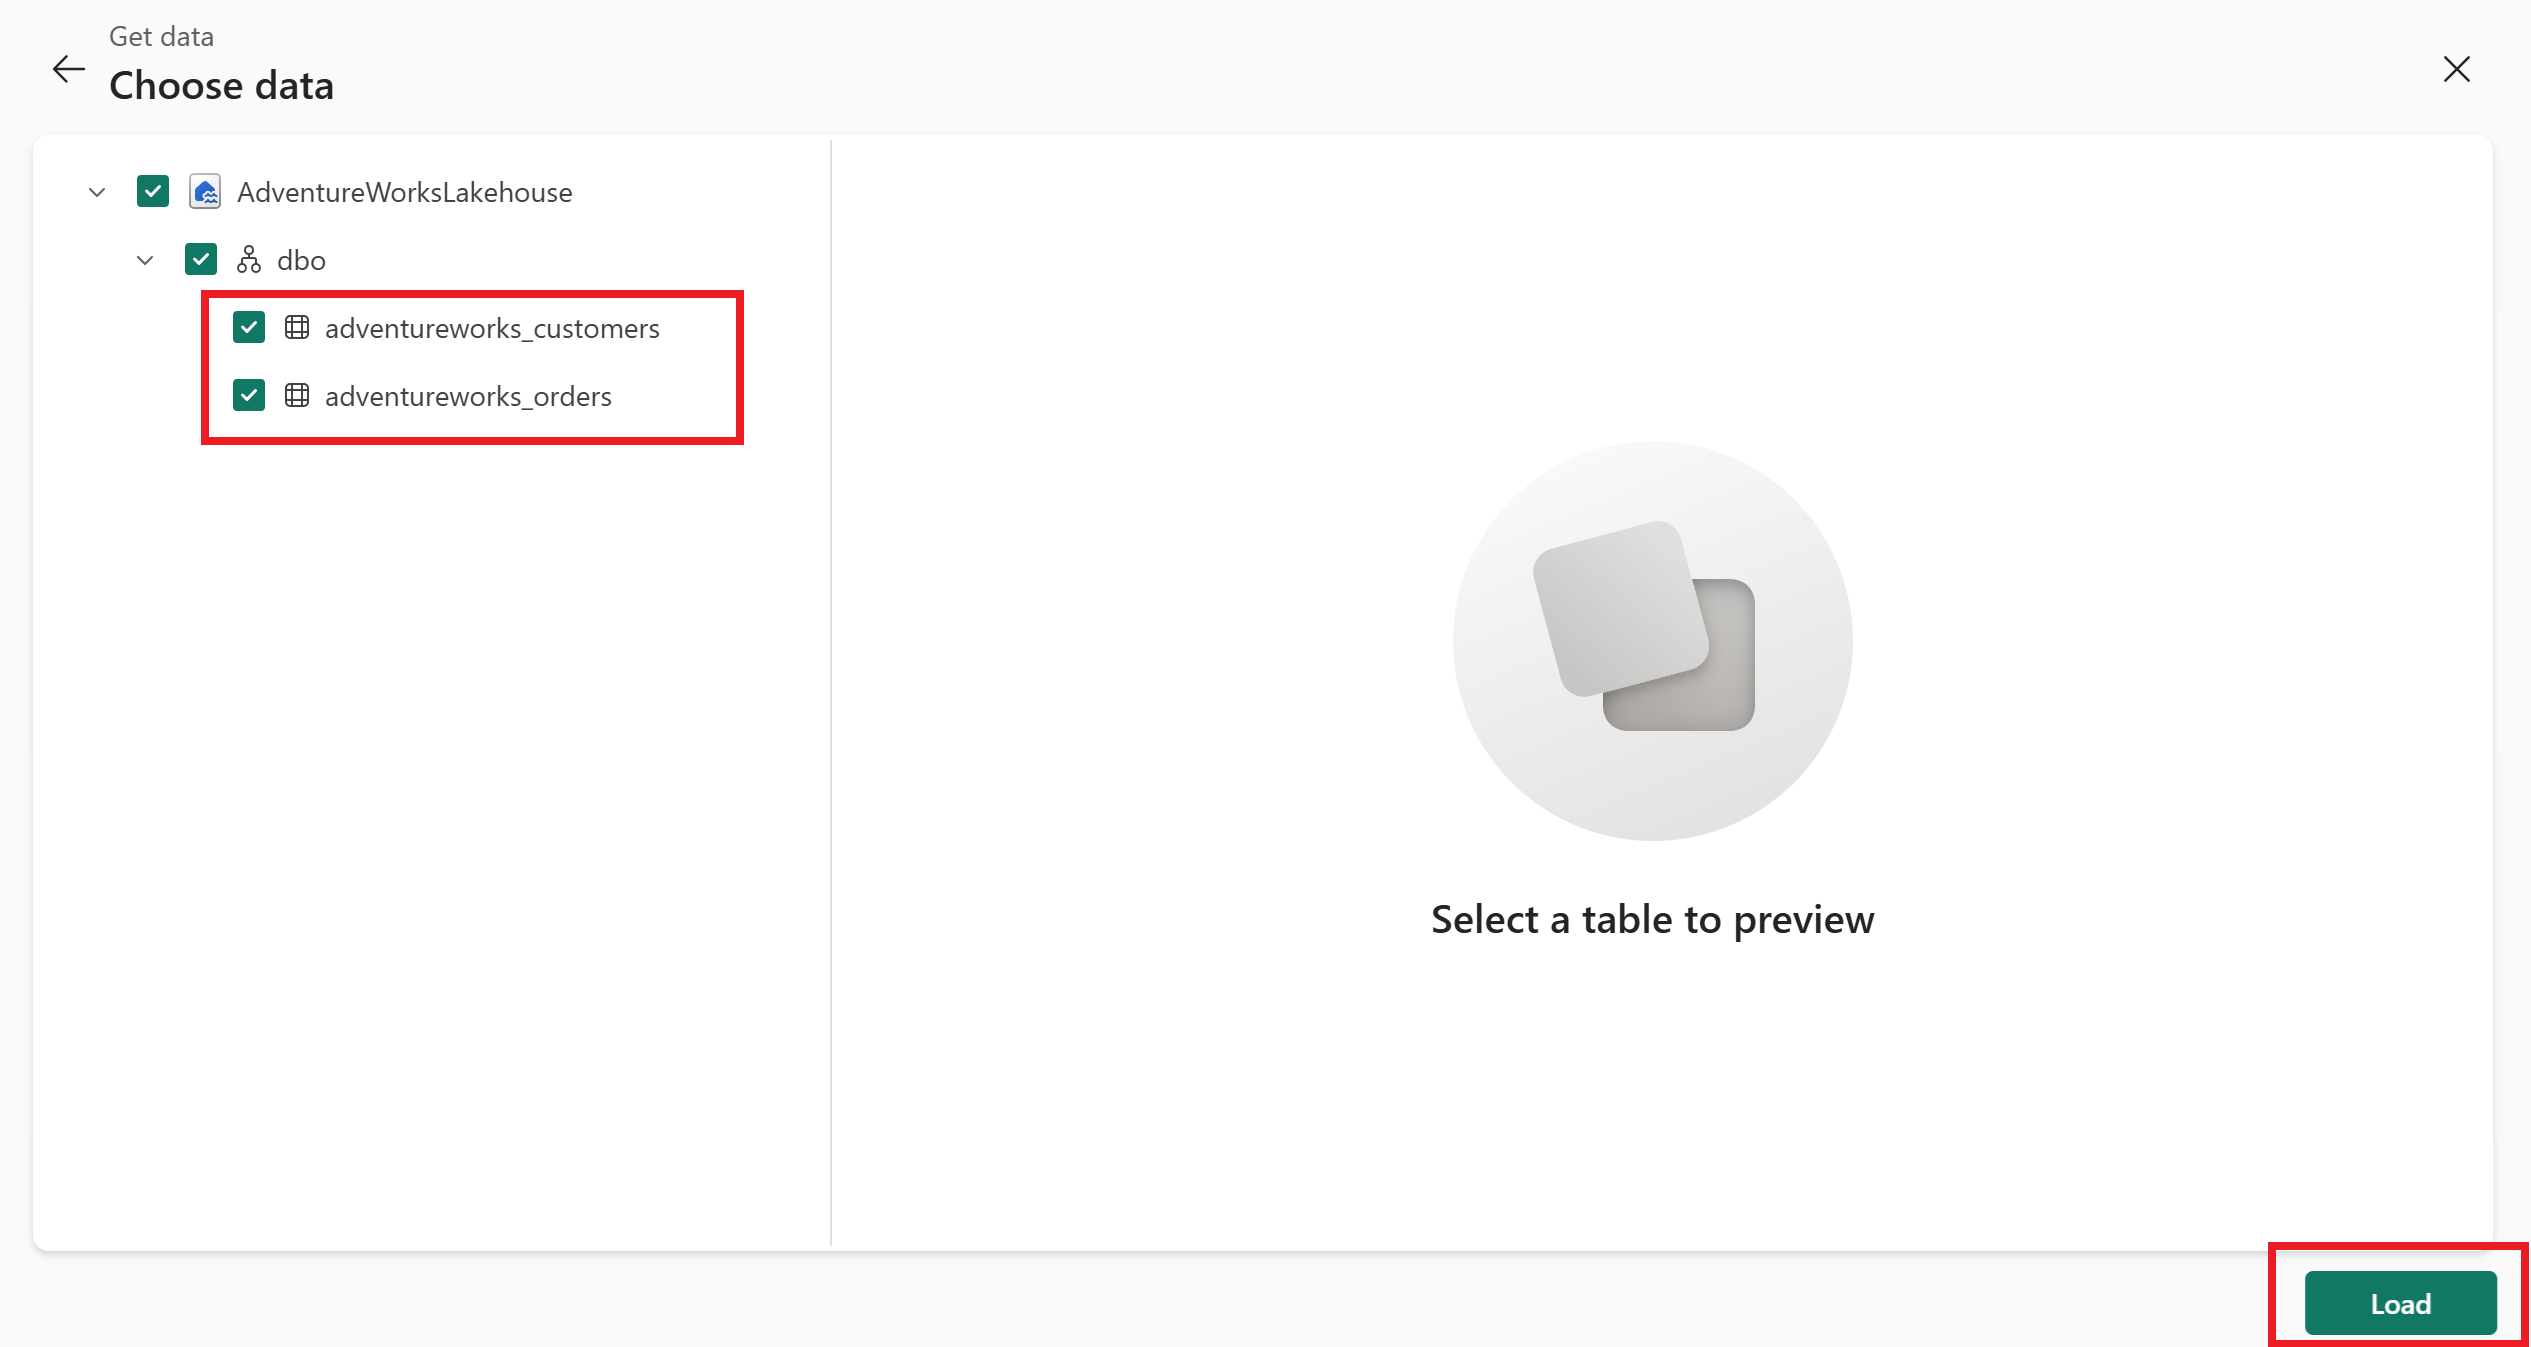
Select the adventureworks_customers and adventureworks_orders tables, and then select Load.

Define your graph's structure
Now that your data is loaded, define your graph's structure by adding nodes and edges. In this quickstart, you add two node types (Customer and Order) and one edge type (purchases) to model the relationship between customers and their orders.
Add two nodes
In the top ribbon, select Add node.
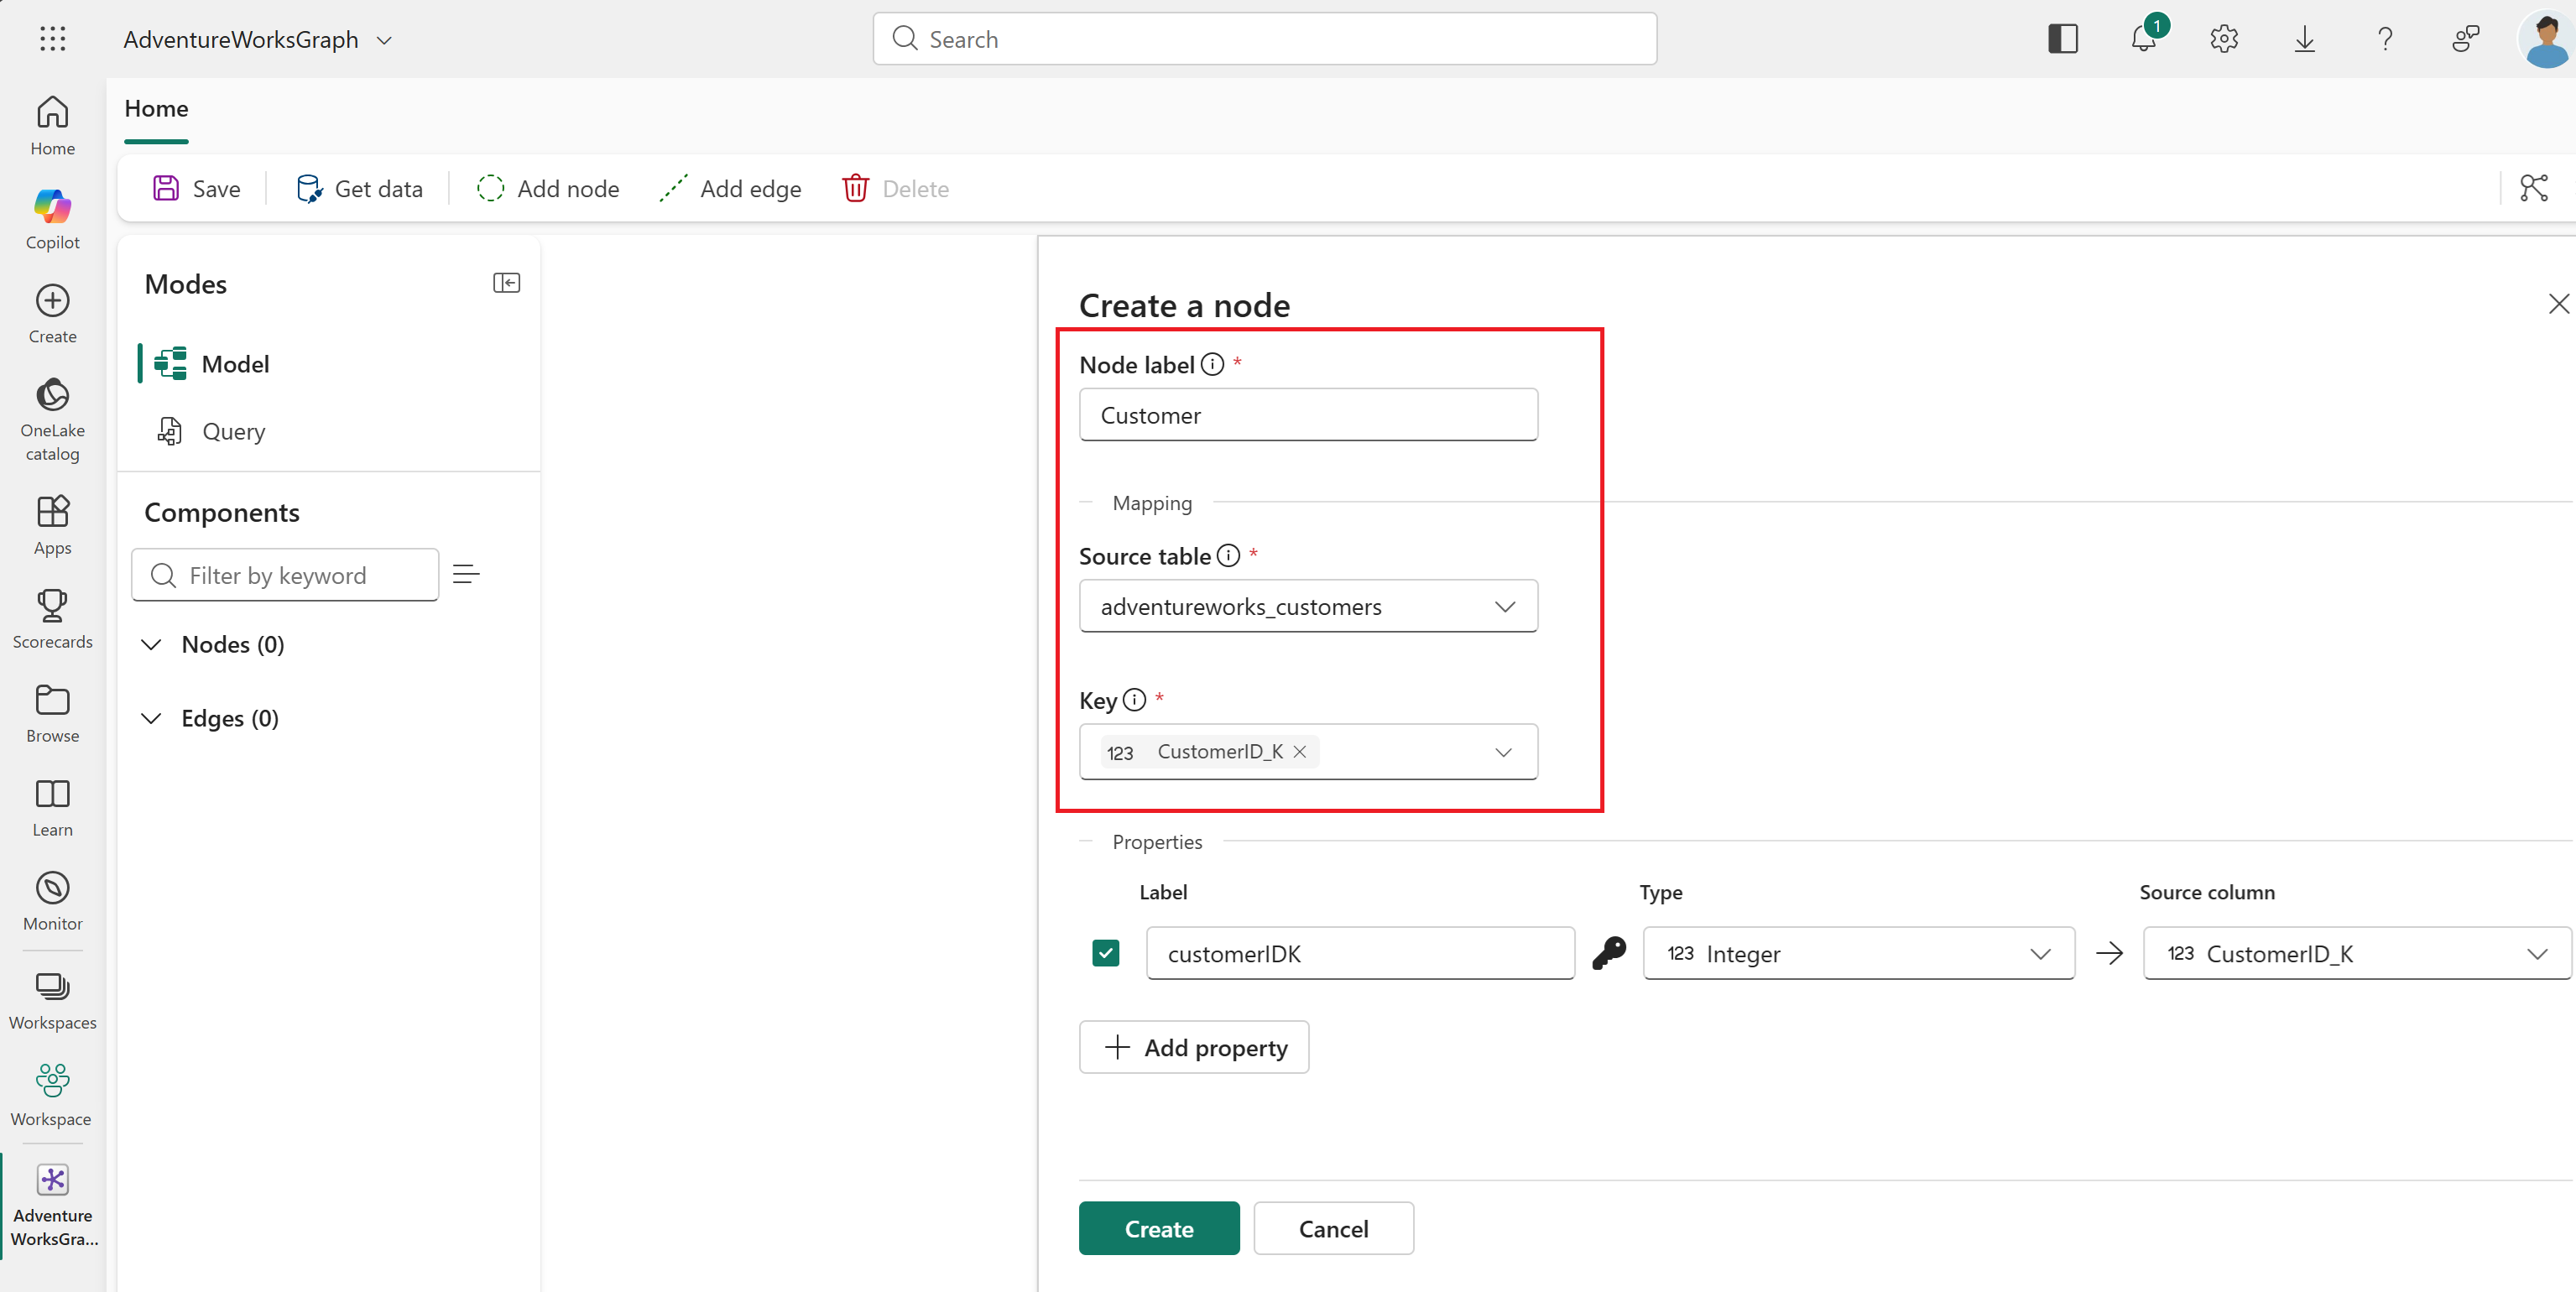
Configure the first node:
- Node label:
Customer - Source table: adventureworks_customers
- Key: CustomerID_K
- Node label:
Select + Add property, Add all columns, and Apply. This step makes all columns in this source table available as properties for the node.

Select Create. You see a node for
Customerappear on the graph canvas.Select Add node again.
Configure the second node:
- Node label:
Order - Source table: adventureworks_orders
- Key: SalesOrderDetailID_K
- Node label:
Select + Add property, Add all columns, and Apply. This step makes all columns in this source table available as properties for the node.
Select Create.


You now have two nodes, Customer and Order, visible on the graph canvas.

Add one edge
In the top ribbon, select Add edge.
Configure the edge:
- Edge label:
purchases - Source table: adventureworks_orders
- Origin node:
Customer - Origin key: CustomerID_FK
- Target node:
Order - Target key: SalesOrderDetailID_K

- Edge label:
Select + Add property, Add all columns, and Apply. This step makes all columns in this source table available as properties for the edge.
Select Create.
In the top ribbon, select Save.

You see the node and edge labels in the graph view canvas.

The data might take a few minutes to finish loading. Wait for the Data load is in progress label to show Data load completed... before proceeding to the next section.

Query your graph
Run a GQL query to find the top five customers by order count.
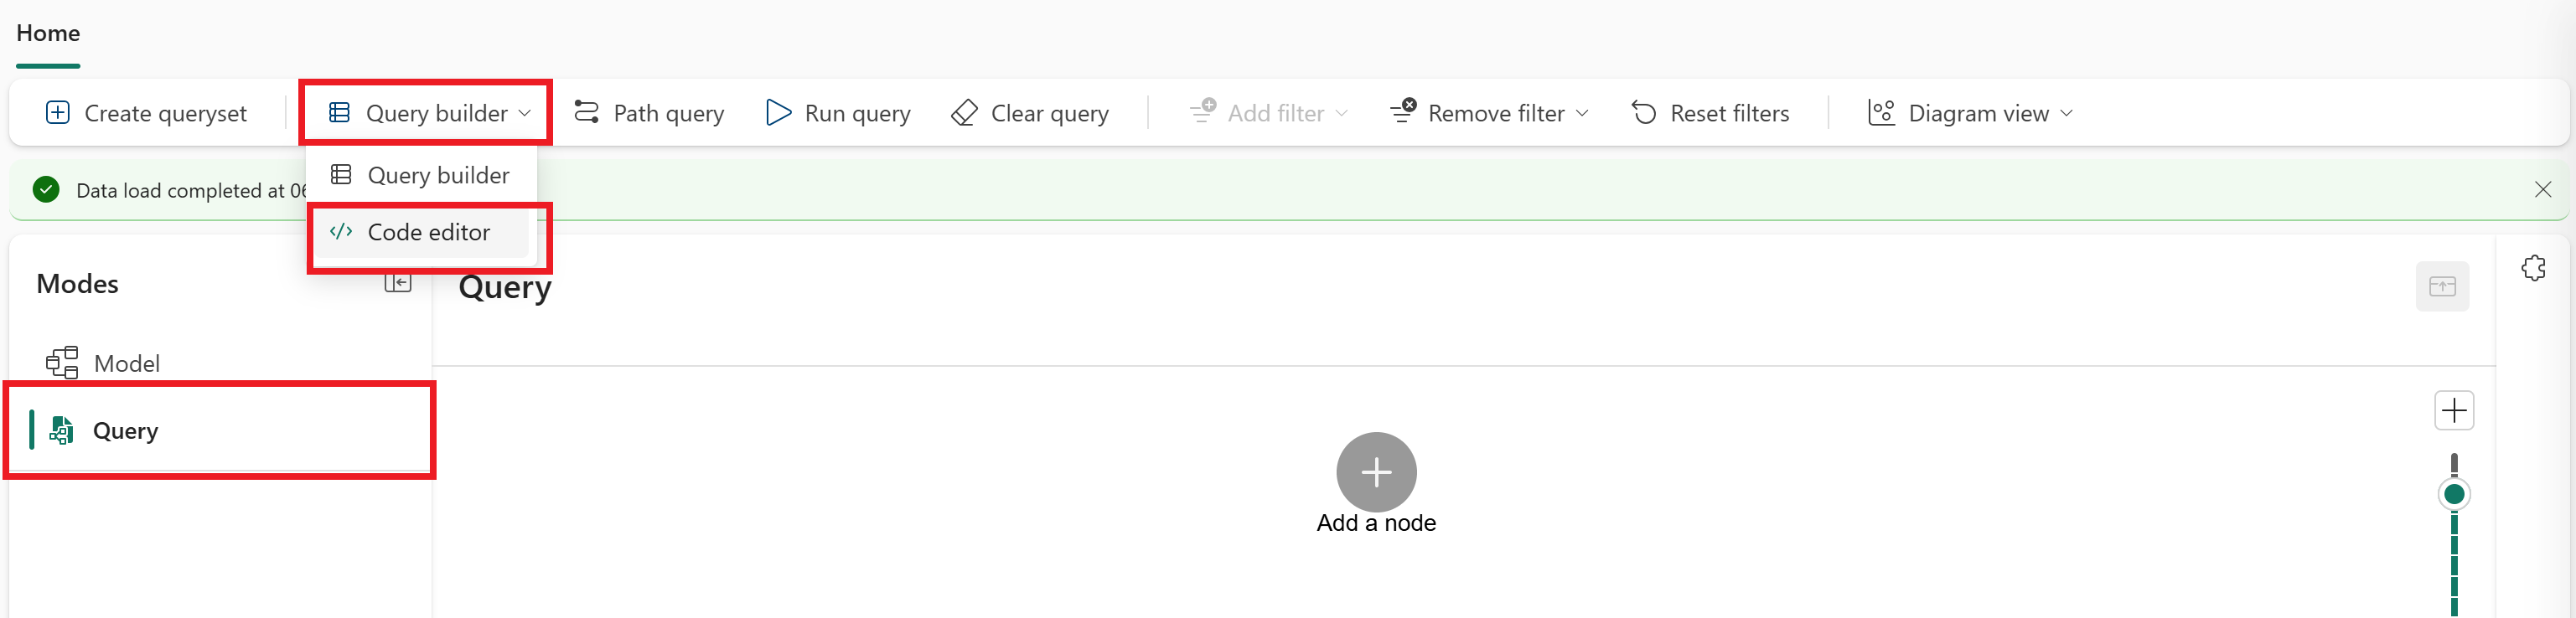
In the Modes panel, select Query mode.
In the top ribbon, select Query builder > Code editor.
Enter the following GQL query in the input box:
MATCH (c:Customer)-[:purchases]->(o:`Order`)
RETURN c.fullName AS customer_name, count(o) AS num_orders
GROUP BY customer_name
ORDER BY num_orders DESC
LIMIT 5
In the top ribbon, select Run query. You see five rows listing customer names and their order counts, sorted from most to fewest orders.


Congratulations! You created your first graph in Microsoft Fabric and ran a query against it.
Next steps
- Graph tutorial: Build a complete graph with multiple nodes, edges, and queries.
- GQL language guide: Learn GQL syntax.
- What is graph in Microsoft Fabric?: Learn about graph concepts.