Bilješka
Pristup ovoj stranici zahtijeva provjeru vjerodostojnosti. Možete pokušati da se prijavite ili promijenite direktorije.
Pristup ovoj stranici zahtijeva provjeru vjerodostojnosti. Možete pokušati promijeniti direktorije.
Important
Azure Monitor OpenTelemetry Profiler for .NET is currently in preview. See the Supplemental Terms of Use for Microsoft Azure Previews for legal terms that apply to Azure features that are in beta, preview, or otherwise not yet released into general availability.
Azure Monitor OpenTelemetry Profiler Preview for .NET tracks how much time each method in your live ASP.NET Core web apps spends running, so you can pinpoint the code paths that slow down performance.
This article shows you how to enable Azure Monitor OpenTelemetry Profiler Preview for .NET on an ASP.NET Core web app hosted in Linux on Azure App Service. You can also set up the sample project in Windows and macOS development environments.
In this article, you:
- Set up an ASP.NET Core web app hosted on Linux on your local computer.
- Create an App Service by using the Azure portal.
- Deploy your local ASP.NET Core project to Azure by using local Git.
- Add the .NET Profiler to the ASP.NET Core web app.
Note
Review the Application Insights SDK support guidance for SDK support policy. For migration guidance, see Migrate from Application Insights SDKs to Azure Monitor OpenTelemetry.
Caution
For new applications, use the Azure Monitor OpenTelemetry Distro. It provides a similar experience and comparable functionality to the Application Insights SDK. To migrate to an OpenTelemetry-based offering, review the migration guidance.
Prerequisites
- Install the latest .NET Core SDK.
- Install Git by following the instructions at Getting started: Installing Git.
- Review the Enable Azure Monitor Profiler for an ASP.NET Core Web API sample for context.
Set up the project locally
Create a sample ASP.NET Core web app on your local computer and add the NuGet packages that collect Profiler traces.
Open a command prompt window on your computer.
Create an ASP.NET Core MVC web app.
dotnet new mvc -n LinuxProfilerTestChange the working directory to the root folder for the project.
Add the NuGet packages to collect the Profiler traces.
dotnet add package Azure.Monitor.OpenTelemetry.AspNetCore --prerelease
dotnet add package Azure.Monitor.OpenTelemetry.Profiler --prerelease
Enable the .NET Profiler
Configure your application to collect Profiler traces. Select the tab for the offering you use.
In your preferred code editor, verify that you added the two packages for the Azure Monitor OpenTelemetry Profiler for .NET to
Program.cs. Add custom Profiler settings, if applicable.In your project's
.csprojfile, verify that you added the following lines:<ItemGroup> <PackageReference Include="Azure.Monitor.OpenTelemetry.AspNetCore" Version="[1.*-*, 2.0.0)" /> <PackageReference Include="Azure.Monitor.OpenTelemetry.Profiler" Version="[1.*-*, 2.0.0)" /> </ItemGroup>In your
Program.csfile, verify that you added the following lines:using Azure.Monitor.OpenTelemetry.AspNetCore; using Azure.Monitor.OpenTelemetry.Profiler; /// builder.Services.AddOpenTelemetry() .UseAzureMonitor() // Enable Azure Monitor OpenTelemetry distro for ASP.NET Core .AddAzureMonitorProfiler(); // Add Azure Monitor ProfilerSave and commit your changes to the local repository:
git init
git add .
git commit -m "first commit"
Create the Linux web app to host your project
Create an App Service web app on Linux to host your project, and set up local Git deployment credentials.
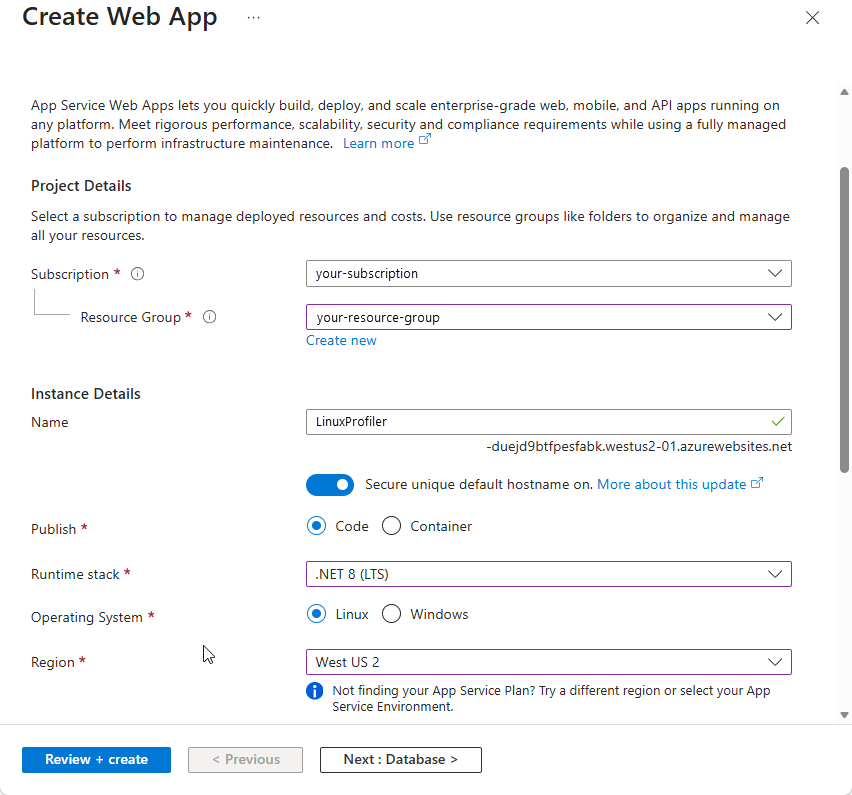
In the Azure portal, search for and select App Services, and then select Create > Web App.
Create a web app environment by using App Service on Linux.
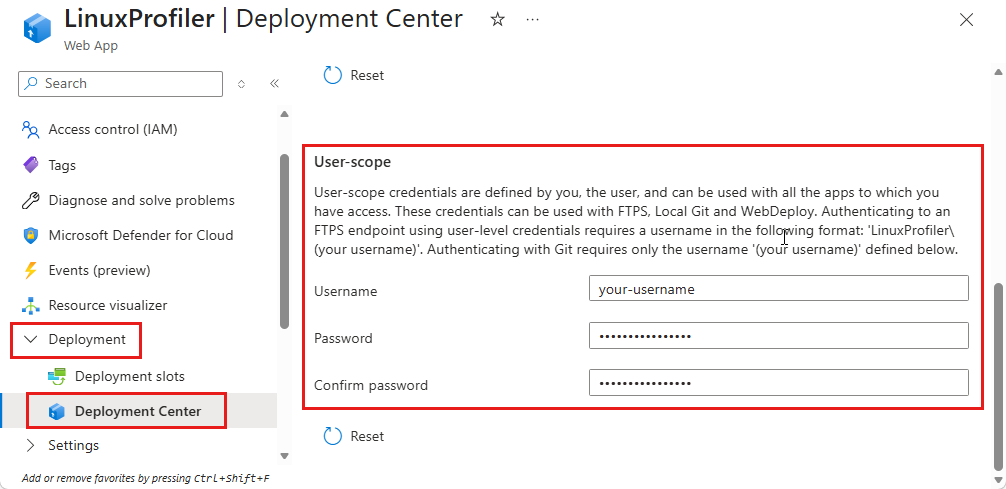
Go to your new web app resource. In the left menu, select Deployment > Deployment Center, and then select FTPS Credentials to create the deployment credentials. Make a note of your credentials to use later.
Select Save.
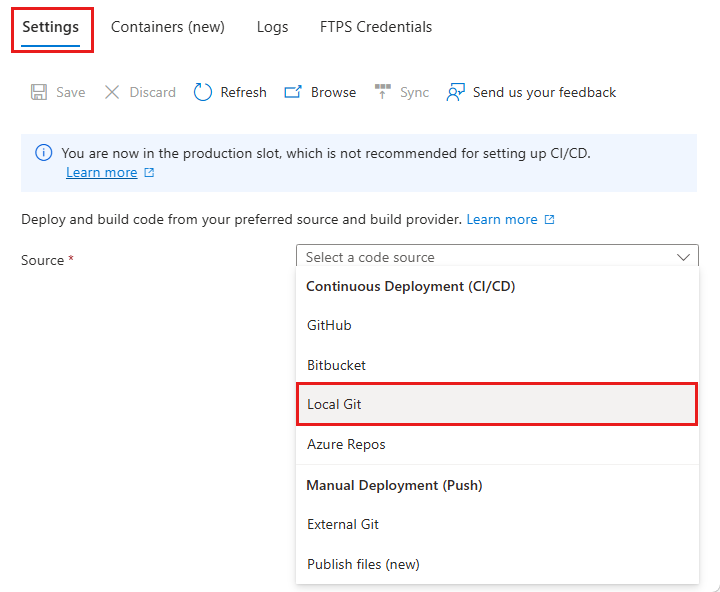
Select the Settings tab.
To set up a local Git repository in the web app, select Source, and then select Local Git.
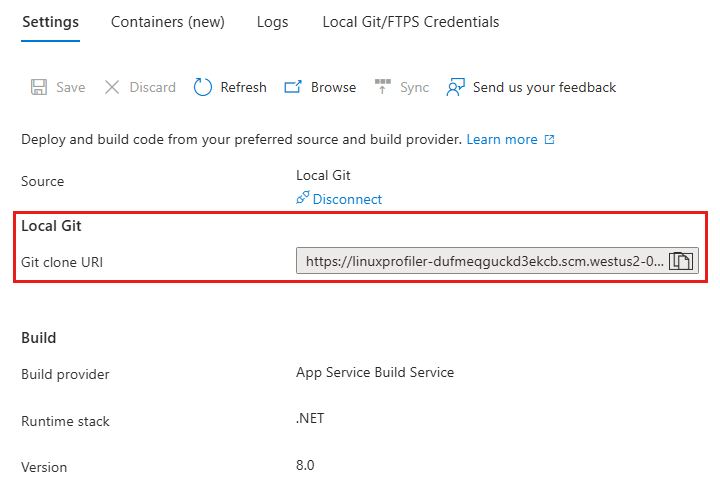
Select Save to create a Git repository with a Git clone URI.
For more deployment options, see the App Service documentation.
Deploy your project to Azure App Service
You can deploy code to Azure App Service in various ways. The simplest way is to deploy by using local Git. For more information, see Deploy to Azure App Service by using local Git.
In your command prompt window, browse to the root folder for your project. Add a Git remote repository to point to the repository on App Service:
git remote add azure https://<username>@<app_name>.scm.azurewebsites.net:443/<app_name>.gitFor this value, go to the Overview page for your web app. Copy Git clone url.
Deploy the project by pushing the changes to Azure App Service:
git push azure main
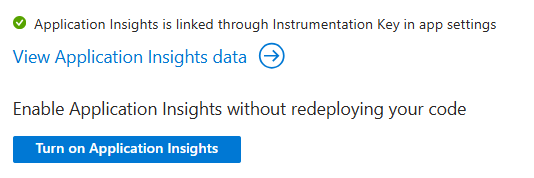
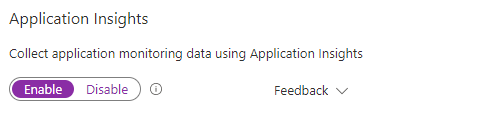
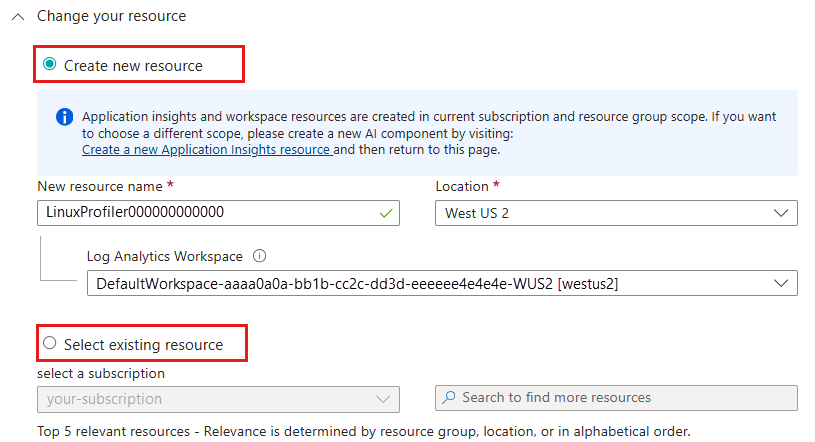
Add Application Insights to monitor your web app
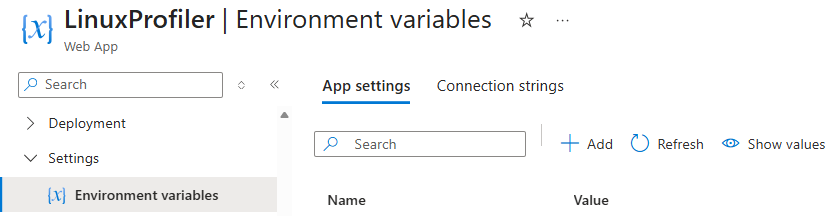
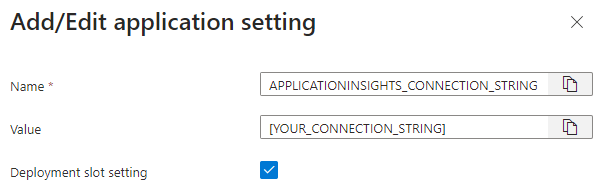
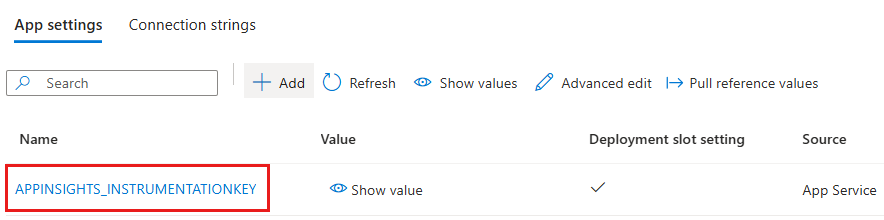
To view Profiler traces, connect your web app to an Application Insights resource. If you enable Application Insights when you create the App Service, Azure sets the connection string automatically. Otherwise, use one of the following methods to set the connection string. Select the tab for the offering you use.
Copy and paste your connection string from your Application Insights resource to monitor your web app.
Troubleshoot missing Profiler traces
If Profiler traces don't appear in your Application Insights resource, use the troubleshooting guide for your offering. Select the tab for the offering you use.
If you can't find traces from your app, try the steps in this troubleshooting guide.