Bilješka
Pristup ovoj stranici zahtijeva provjeru vjerodostojnosti. Možete pokušati da se prijavite ili promijenite direktorije.
Pristup ovoj stranici zahtijeva provjeru vjerodostojnosti. Možete pokušati promijeniti direktorije.
Application Insights Profiler for .NET traces show which method calls and lines of code consume the most time while your app handles requests. Suppose you're running a web performance test. You need traces to understand how your web app runs under load.
This article shows you how to generate traffic to your service, view the .NET Profiler traces, and read the performance data and call stack to identify bottlenecks.
In this article, you:
- Generate traffic to your web app by starting a web performance test or starting a Profiler on-demand session.
- View the Profiler traces after your load test or Profiler session.
- Read the .NET Profiler performance data and call stack.
Generate traffic to your Azure service
For the .NET Profiler to upload traces, your service must actively handle requests. If you just enabled the .NET Profiler, run a short load test with Azure Load Testing.
In the Azure portal, open your Application Insights resource. From the left menu, select Investigate > Performance.
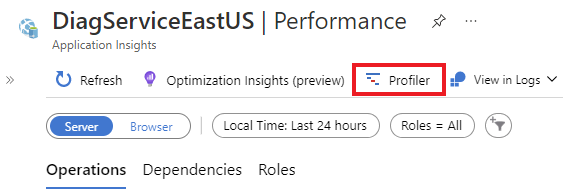
On the Performance pane, select Profiler from the top menu for Profiler settings.
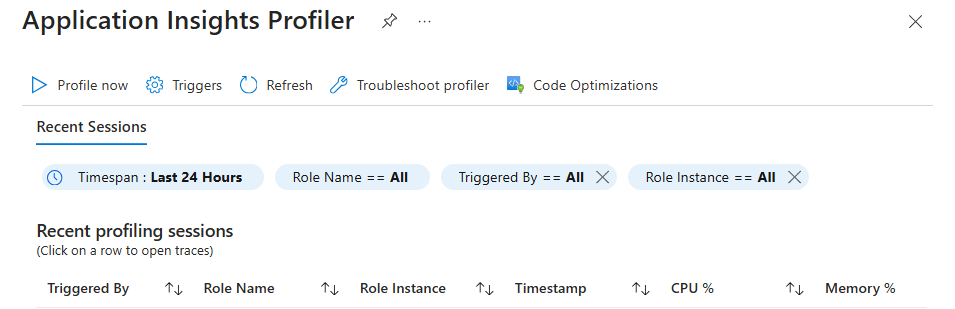
After the Profiler settings page loads, select Profile Now.
View .NET Profiler traces
After the Profiler sessions finish running, return to the Performance pane.
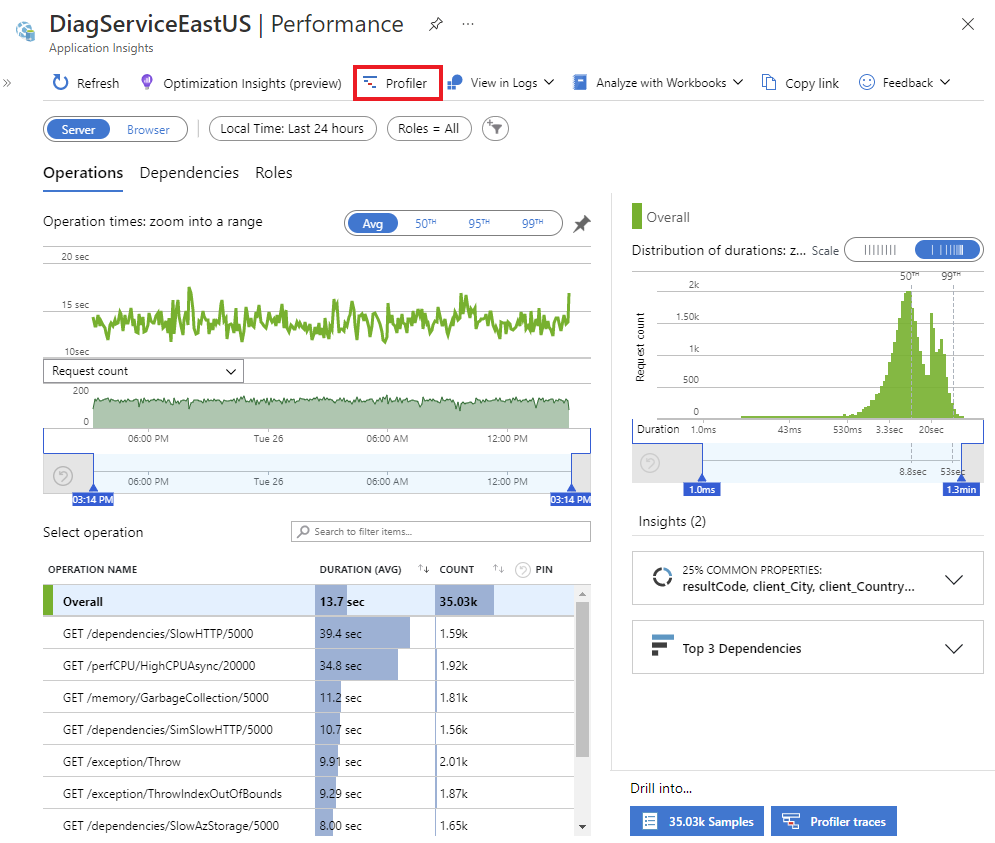
Under Drill into..., select Profiler traces to view the traces.
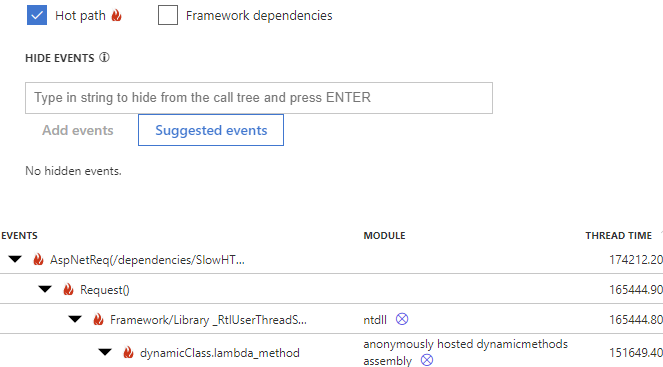
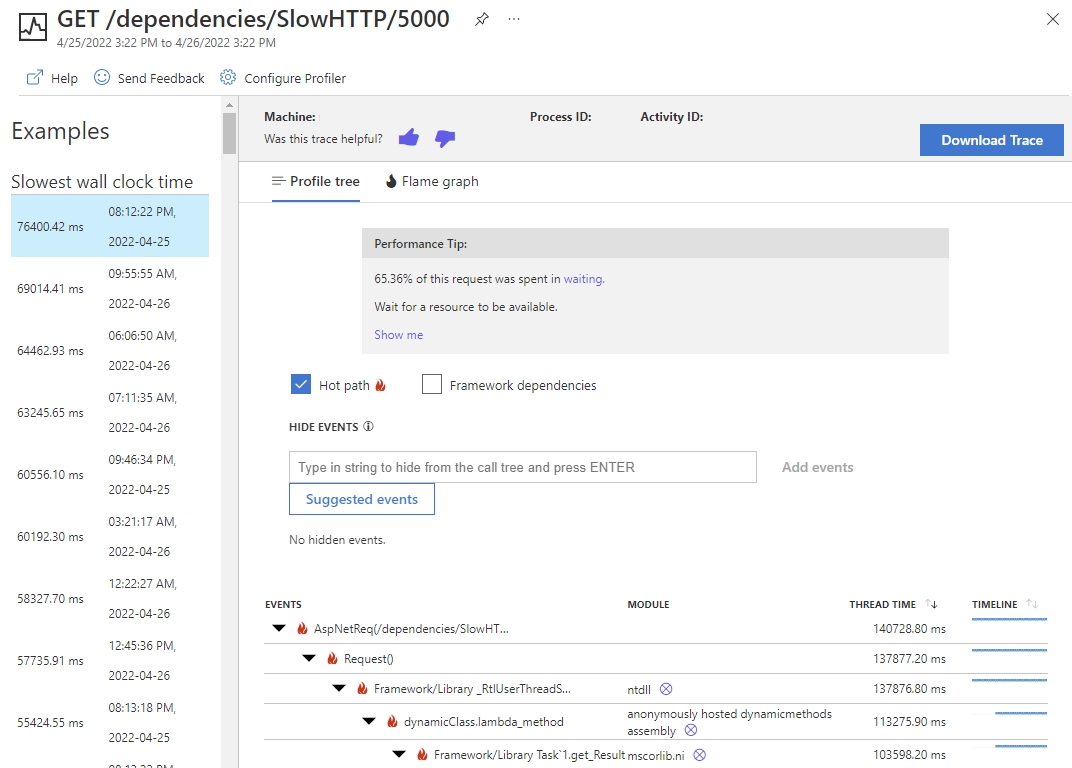
The trace explorer shows the following information:
| Filter | Description |
|---|---|
| Profile tree v. Flame graph | View the traces as either a tree or in graph form. |
| Hot path | Select to open the biggest leaf node. In most cases, this node is near a performance bottleneck. |
| Framework dependencies | Select to view each of the traced framework dependencies associated with the traces. |
| Hide events | Enter strings to hide from the trace view. Select Suggested events for suggestions. |
| Event | Event or function name. The tree displays a mix of code and events that occurred, such as SQL and HTTP events. The top event represents the overall request duration. |
| Module | The module where the traced event or function occurred. |
| Thread time | The time interval between the start of the operation and the end of the operation. |
| Timeline | The time when the function or event was running in relation to other functions. |
Read .NET Profiler performance data and call stack
The .NET Profiler uses a combination of sampling methods and instrumentation to analyze your application's performance. While performing detailed collection, the .NET Profiler:
Samples the instruction pointer of each machine CPU every millisecond.
Each sample captures the complete call stack of the thread, giving detailed information at both high and low levels of abstraction.
Collects events to track activity correlation and causality, including:
- Context switching events
- Task Parallel Library (TPL) events
- Thread pool events
The timeline view shows the call stack that results from the sampling and instrumentation. Each sample captures the complete call stack of the thread. It includes code from the Microsoft .NET Framework and any other frameworks that you reference.
Object allocation (clr!JIT_New or clr!JIT_Newarr1)
clr!JIT_New and clr!JIT_Newarr1 are helper functions in .NET Framework that allocate memory from a managed heap.
clr!JIT_Newis invoked when an object is allocated.clr!JIT_Newarr1is invoked when an object array is allocated.
These two functions usually work quickly. If clr!JIT_New or clr!JIT_Newarr1 take up time in your timeline, the code might be allocating many objects and consuming significant amounts of memory.
Loading code (clr!ThePreStub)
clr!ThePreStub is a helper function in .NET Framework that prepares the code for initial execution, which usually includes just-in-time (JIT) compilation. For each C# method, the .NET Framework runtime invokes clr!ThePreStub once, at most, during a process.
If clr!ThePreStub takes extra time for a request, it's the first request to execute that method. The .NET Framework runtime takes a significant amount of time to load the first method. Consider:
- Using a warmup process that runs that portion of the code before your users access it.
- Running Native Image Generator (
ngen.exe) on your assemblies.
Lock contention (clr!JITutil_MonContention or clr!JITutil_MonEnterWorker)
clr!JITutil_MonContention or clr!JITutil_MonEnterWorker indicates that the current thread is waiting for a lock to be released. This text often appears when you:
- Execute a C#
lockstatement - Invoke the
Monitor.Entermethod - Invoke a method with the
MethodImplOptions.Synchronizedattribute
Lock contention usually occurs when thread A acquires a lock and thread B tries to acquire the same lock before thread A releases it.
Loading code ([COLD])
If the .NET Framework runtime is running unoptimized code for the first time, the method name contains [COLD]:
mscorlib.ni![COLD]System.Reflection.CustomAttribute.IsDefined
Each method appears once during the process, at most.
If loading code takes a substantial amount of time for a request, it's the request's initial execution of the unoptimized portion of the method. Consider using a warmup process that runs that portion of the code before your users access it.
Send HTTP request
Methods such as HttpClient.Send indicate that the code is waiting for an HTTP request to finish.
Database operation
Methods such as SqlCommand.Execute indicate that the code is waiting for a database operation to finish.
Waiting (AWAIT_TIME)
AWAIT_TIME indicates that the code is waiting for another task to finish. This delay occurs with the C# await statement. When the code does a C# await:
- The thread unwinds and returns control to the thread pool.
- No blocked thread waits for the
awaitto finish.
However, logically, the thread that did the await is blocked, waiting for the operation to finish. The AWAIT_TIME statement indicates the blocked time, waiting for the task to finish.
If the AWAIT_TIME appears to be in framework code instead of your code, the .NET Profiler could be showing:
- The framework code that runs the
await - Code that records telemetry about the
await
To show only your code and make it easier to see where the await originates, at the top of the page, unselect Framework dependencies.
Blocked time
BLOCKED_TIME indicates that the code is waiting for another resource to be available. For example, it might be waiting for:
- A synchronization object
- A thread to be available
- A request to finish
Unmanaged async
For the .NET Profiler to track async calls across threads, .NET Framework emits Event Tracing for Windows (ETW) events and passes activity IDs between threads. Because unmanaged (native) code and some older styles of asynchronous code lack these events and activity IDs, the .NET Profiler can't track the thread and functions running on the thread.
The .NET Profiler labels this item Unmanaged Async in the call stack. Download the ETW file to use PerfView for more insight.
CPU time
CPU time, labeled CPU_TIME in the trace, is a .NET Profiler call-stack indicator that shows the CPU is busy executing the sampled thread's instructions. When CPU_TIME appears on a node in the call stack, the .NET Profiler samples that thread while it actively runs code on a processor rather than waiting on another resource. A high CPU_TIME value identifies compute-bound work in the associated method or line of code.
Disk time
Disk time is a .NET Profiler call-stack indicator (canonical label disk time) that shows the application is performing disk operations, such as reading from or writing to storage. When disk time appears on a node in the trace, the sampled thread was waiting on or performing disk I/O rather than executing CPU instructions. A high disk time value identifies I/O-bound work in the associated method or line of code.
Network time
Network time is a .NET Profiler call-stack indicator (canonical label network time) that shows the application is performing network operations, such as sending or receiving data over a connection. When network time appears on a node in the trace, the sampled thread was waiting on or performing network I/O rather than executing CPU instructions. A high network time value identifies network-bound work in the associated method or line of code.
When column
The When column visualizes the variety of inclusive samples collected for a node over time. The .NET Profiler divides the total range of the request into 32 time buckets, where the node's inclusive samples accumulate. Each bucket appears as a bar. The height of the bar represents a scaled value.
For the following nodes, the bar represents the consumption of one of the resources during the bucket:
- Nodes marked
CPU_TIMEorBLOCKED_TIME. - Nodes with an obvious relationship to consuming a resource, such as a CPU, disk, or thread.
For these metrics, you can get a value greater than 100% by consuming multiple resources. For example, if you use two CPUs during an interval on average, you get 200%.