Bilješka
Pristup ovoj stranici zahtijeva provjeru vjerodostojnosti. Možete pokušati da se prijavite ili promijenite direktorije.
Pristup ovoj stranici zahtijeva provjeru vjerodostojnosti. Možete pokušati promijeniti direktorije.
Application Insights Profiler for .NET captures performance traces from your live app so you can pinpoint the code paths that slow down requests.
This article shows you how to use the Azure portal to enable the .NET Profiler for an Azure Functions app that runs on the App Service plan.
In this article, you use the Azure portal to:
- View the current app settings for your Functions app.
- Add two new app settings that enable the .NET Profiler on the Functions app.
- Open the Profiler page for your Functions app to view trace data.
Note
You can enable the Application Insights Profiler for .NET for Azure Functions apps on the App Service plan.
Prerequisites
An Azure Functions app. Verify your Functions app is on the App Service plan.
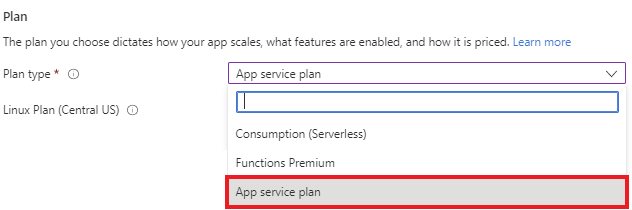
Link your app to an Application Insights resource. Note the connection string.
App settings to enable the .NET Profiler
| App Setting | Value |
|---|---|
| APPLICATIONINSIGHTS_CONNECTION_STRING | Unique value from your Application Insights resource. |
| APPINSIGHTS_PROFILERFEATURE_VERSION | 1.0.0 |
| DiagnosticServices_EXTENSION_VERSION | ~3 |
Add app settings to your Azure Functions app
In the Azure portal, open your Functions app Overview page:
Under Settings, select Environment variables. Verify that the settings list includes the
APPLICATIONINSIGHTS_CONNECTION_STRINGsetting.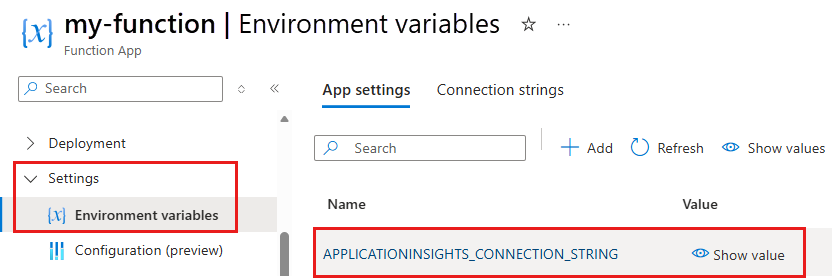
Select Add.

Copy each setting name and its Value from the preceding table into the corresponding fields. Add
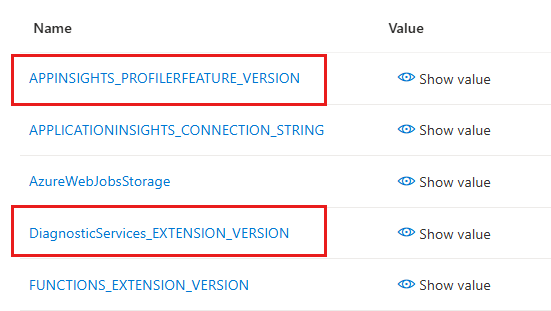
APPINSIGHTS_PROFILERFEATURE_VERSIONwith the value1.0.0andDiagnosticServices_EXTENSION_VERSIONwith the value~3.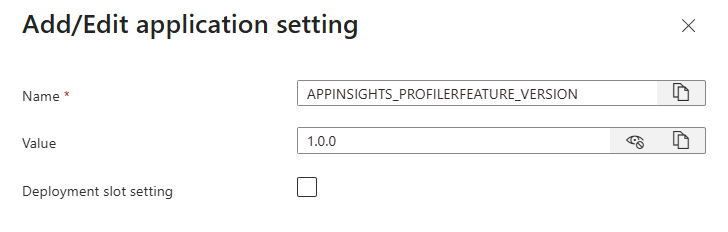
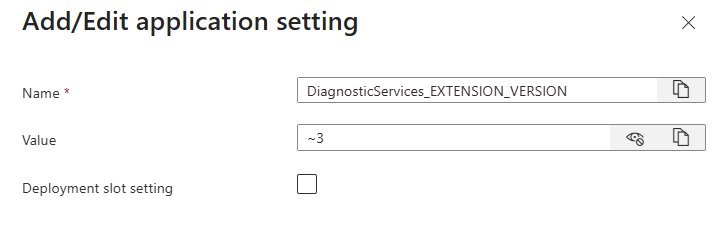
Leave the Deployment slot setting blank for now.
Select Apply for each value.
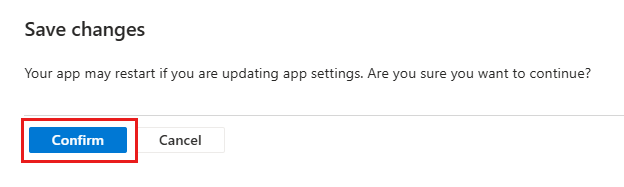
In the Environment variables pane, select Apply, then Confirm.
The app settings now show up in the table:
Note
You can also enable the .NET Profiler by using: