Bilješka
Pristup ovoj stranici zahtijeva provjeru vjerodostojnosti. Možete pokušati da se prijavite ili promijenite direktorije.
Pristup ovoj stranici zahtijeva provjeru vjerodostojnosti. Možete pokušati promijeniti direktorije.
Application Insights Profiler for .NET captures performance traces from your running ASP.NET Core application to show which code paths slow it down under load. When your app runs in a container, you can enable the Profiler with minimal code changes to find and fix these performance bottlenecks in production.
This article shows you how to add the Profiler to a containerized ASP.NET Core app, connect it to your Application Insights resource, and view the traces the Profiler collects.
In this article, you:
- Install the NuGet package and enable the Profiler in your project.
- Set the Application Insights connection string in your app settings.
- Build and run the container, then view the .NET Profiler traces.
Prerequisites
- An Application Insights resource. Note the connection string.
- Docker Desktop to build Docker images.
- .NET 6 SDK installed.
Set up the sample project and enable the .NET Profiler
Clone and use the following sample project:
git clone https://github.com/microsoft/ApplicationInsights-Profiler-AspNetCore.gitGo to the Container App example:
cd ApplicationInsights-Profiler-AspNetCore

cd examples/EnableServiceProfilerForContainerAppNet6
Run the following CLI command to create this barebones example project:
dotnet new mvc -n EnableServiceProfilerForContainerAppThe
Controllers/WeatherForecastController.csfile includes a delay to simulate the bottleneck.[HttpGet(Name = "GetWeatherForecast")] public IEnumerable<WeatherForecast> Get() { SimulateDelay(); ... // Other existing code. } private void SimulateDelay() { // Delay for 500ms to 2s to simulate a bottleneck. Thread.Sleep((new Random()).Next(500, 2000)); }Add the NuGet package to collect the .NET Profiler traces:
dotnet add package Microsoft.ApplicationInsights.Profiler.AspNetCoreEnable Application Insights and the .NET Profiler.
Add
builder.Services.AddApplicationInsightsTelemetry()andbuilder.Services.AddServiceProfiler()after theWebApplication.CreateBuilder()method inProgram.cs:var builder = WebApplication.CreateBuilder(args); builder.Services.AddApplicationInsightsTelemetry(); // Add this line of code to enable Application Insights. builder.Services.AddServiceProfiler(); // Add this line of code to enable Profiler builder.Services.AddControllersWithViews(); var app = builder.Build();For custom settings, see Customize Application Insights Profiler.
Pull the latest ASP.NET Core 6.0 build and runtime images
Go to the .NET Core 6.0 example directory:
cd examples/EnableServiceProfilerForContainerAppNet6Pull the latest ASP.NET Core images:
docker pull mcr.microsoft.com/dotnet/sdk:6.0
docker pull mcr.microsoft.com/dotnet/aspnet:6.0
Tip
Find the official Docker images for the .NET SDK and ASP.NET Core runtime.
Add your Application Insights connection string
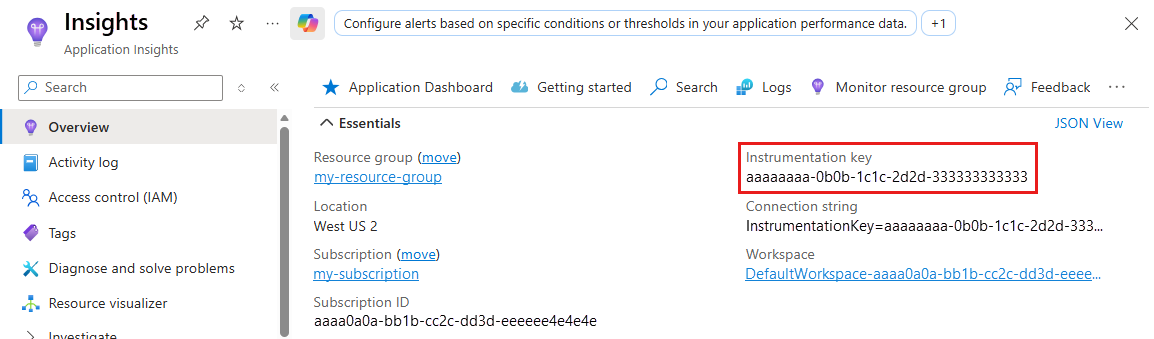
In the Azure portal, open your Application Insights resource. In the Overview page, note your Application Insights connection string.
Open
appsettings.jsonand add your Application Insights connection string to this code section:{ "ApplicationInsights": { "ConnectionString": "Your connection string" } }
Build and run the Docker image
Review the Docker file.
Build the example image:
docker build -t profilerapp .Run the container:
docker run -d -p 8080:80 --name testapp profilerapp
View the container in your browser
To reach the sample app's weatherforecast endpoint, you have two options:
Visit
http://localhost:8080/weatherforecastin your browser.Use
curl:curl http://localhost:8080/weatherforecast
Inspect the container logs for a profiling session
Optionally, inspect the local log to see if a .NET Profiler session finished:
docker logs testapp
In the local logs, note the following events:
Starting application insights profiler with connection string: your-connection string # Double check the connection string
Service Profiler session started.               # Profiler started.
Finished calling trace uploader. Exit code: 0   # Uploader is called with exit code 0.
Service Profiler session finished.              # A profiling session is completed.
Troubleshoot missing .NET Profiler traces
If you can't find traces from your app, consider following the steps in this troubleshooting guide.
View the .NET Profiler traces
Wait for two to five minutes so that Application Insights can aggregate the events.
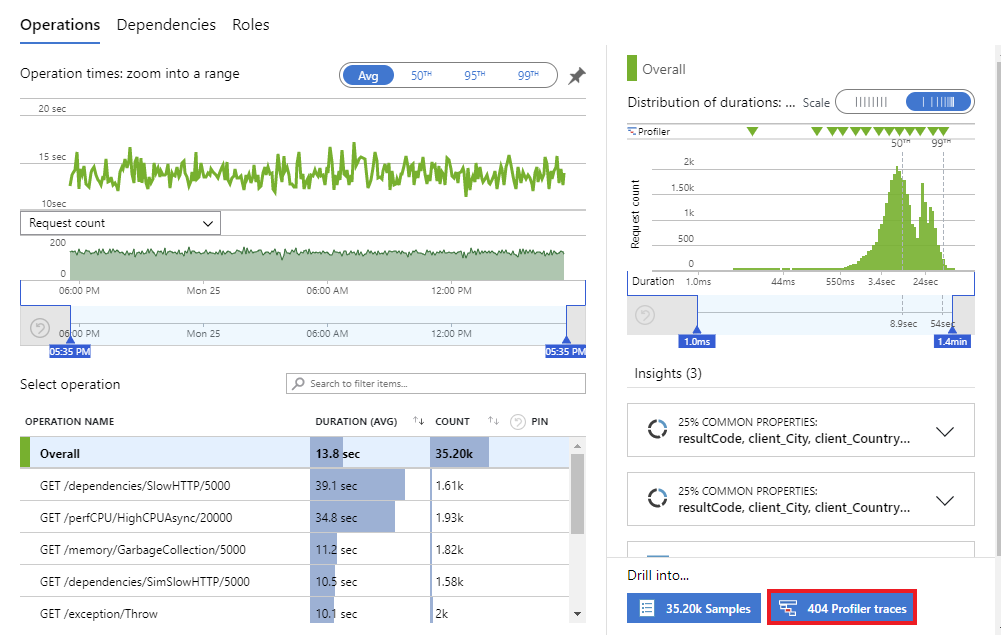
In the Azure portal, open your Application Insights resource. From the left menu, select Investigate > Performance.
After the trace process finishes, the Profiler Traces button appears.
Clean up resources
Run the following command to stop the example project:
docker rm -f testapp