Bilješka
Pristup ovoj stranici zahtijeva provjeru vjerodostojnosti. Možete pokušati da se prijavite ili promijenite direktorije.
Pristup ovoj stranici zahtijeva provjeru vjerodostojnosti. Možete pokušati promijeniti direktorije.
Note
We recommend that you use the Azure Az PowerShell module to interact with Azure. To get started, see Install Azure PowerShell. To learn how to migrate to the Az PowerShell module, see Migrate Azure PowerShell from AzureRM to Az.
Application Insights Profiler for .NET captures traces that show which code paths slow down your web app when it's running under load. With this information, you can pinpoint the methods that create performance bottlenecks and focus your optimization work where it has the most effect.
In this article, you enable Profiler for .NET for a web app that runs on a Windows virtual machine (VM) or virtual machine scale set in Azure. Profiler for .NET doesn't support on-premises servers.
In this article, you learn how to:
- Add the Application Insights SDK to your application.
- Confirm the latest stable release of the Application Insights SDK.
- Enable the .NET Profiler by using Visual Studio and an Azure Resource Manager template (ARM template), PowerShell, or Azure Resource Explorer.
Prerequisites
A functioning ASP.NET Core application.
The ARM templates for the Azure Diagnostics extension:
Add the Application Insights SDK to your application
Open your ASP.NET Core project in Visual Studio.
Select Project > Add Application Insights Telemetry.
Select Azure Application Insights, then select Next.
Select the subscription where your Application Insights resource lives, then select Next.
Select where to save the connection string, then select Next.
Select Finish.
Note
For full instructions, including how to enable Application Insights on your ASP.NET Core application without Visual Studio, see Monitor .NET and Node.js applications.
Confirm the latest stable release of the Application Insights SDK
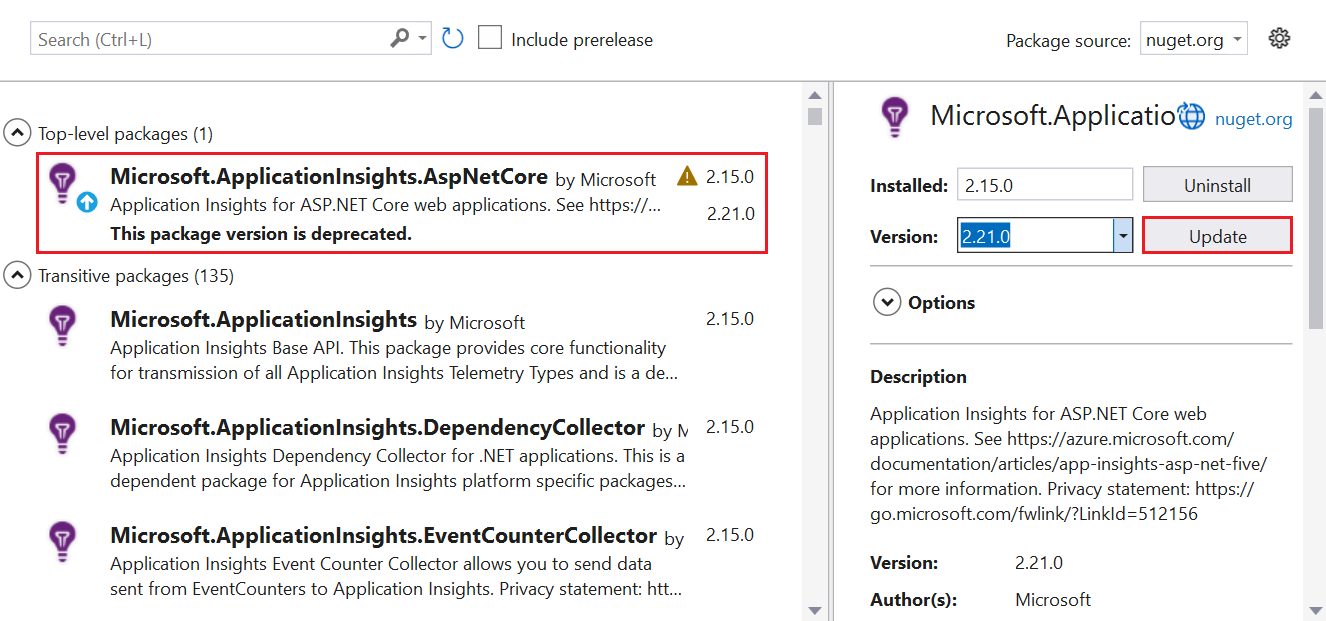
Go to Project > Manage NuGet Packages.
Select Microsoft.ApplicationInsights.AspNetCore.
On the side pane, select the latest version of the SDK from the dropdown list.
Select Update.
Enable the .NET Profiler on a Windows VM or virtual machine scale set
Enable Profiler in one of these ways:
- Within your ASP.NET Core application by using an ARM template and Visual Studio. Recommended.
- By using a PowerShell command.
- By using Azure Resource Explorer.
Using an ARM template and Visual Studio is the recommended method for enabling the .NET Profiler on a Windows VM or virtual machine scale set.
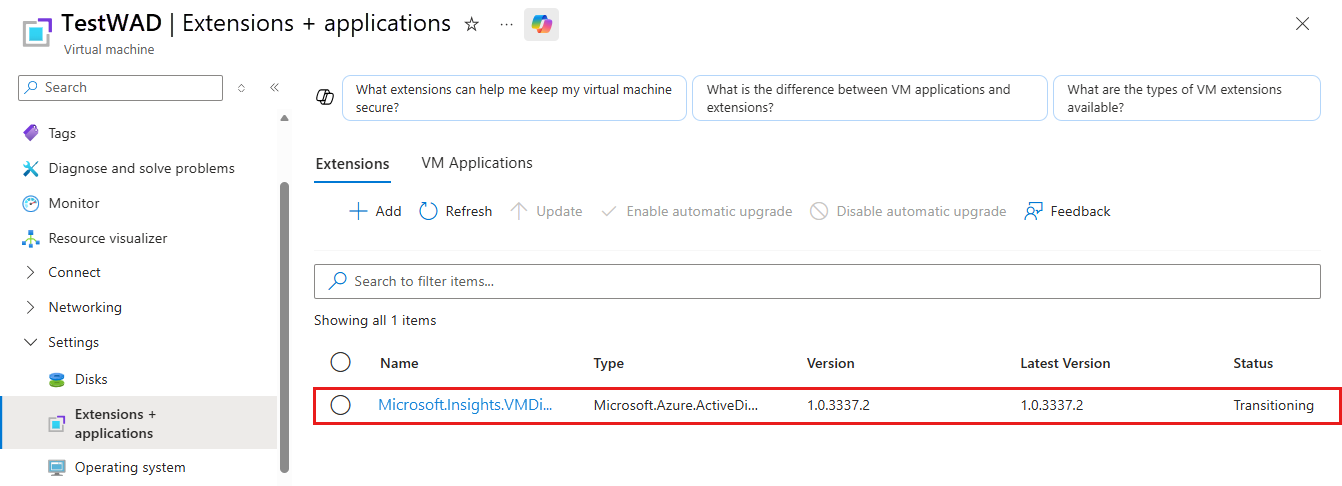
Install the Azure Diagnostics extension
Choose which ARM template to use:
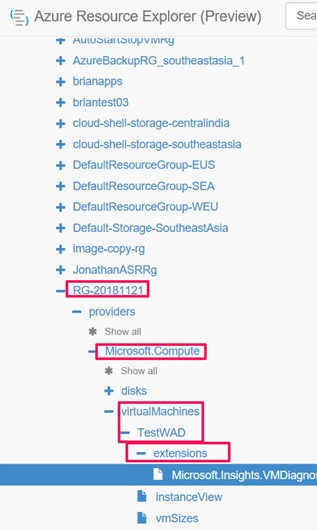
In the template, locate the resource of type
extension.In Visual Studio, open the
arm.jsonfile that the Application Insights SDK added to your ASP.NET Core application.Add the resource type
extensionfrom the template to thearm.jsonfile to set up a VM or virtual machine scale set with Azure Diagnostics.In the
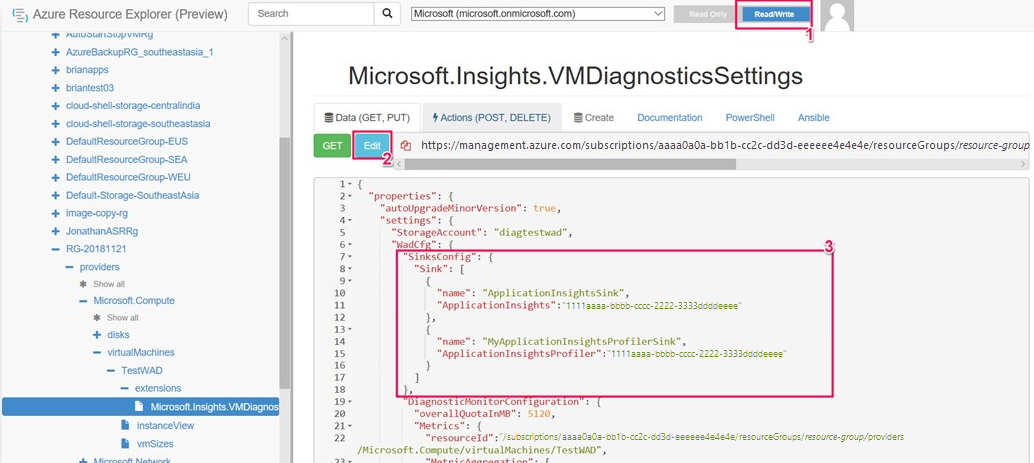
WadCfgnode, add your Application Insights connection string toMyApplicationInsightsProfilerSink."WadCfg": { "SinksConfig": { "Sink": [ { "name": "MyApplicationInsightsProfilerSink", "ApplicationInsightsProfiler": "YOUR_APPLICATION_INSIGHTS_CONNECTION_STRING" } ] } }Deploy your application.
Enable the IIS HTTP Tracing feature
If the application runs through Internet Information Services (IIS), enable the IIS HTTP Tracing Windows feature:
Establish remote access to the environment.
Use the Add Windows features window, or run the following command in PowerShell as administrator:
Enable-WindowsOptionalFeature -FeatureName IIS-HttpTracing -Online -AllIf you can't establish remote access, use the Azure CLI to run the following command:
az vm run-command invoke -g YOUR_RESOURCE_GROUP -n YOUR_VM --command-id RunPowerShellScript --scripts "Enable-WindowsOptionalFeature -FeatureName IIS-HttpTracing -Online -All"Deploy your application.