Bilješka
Pristup ovoj stranici zahtijeva provjeru vjerodostojnosti. Možete pokušati da se prijavite ili promijenite direktorije.
Pristup ovoj stranici zahtijeva provjeru vjerodostojnosti. Možete pokušati promijeniti direktorije.
The Experience insights (preview) dashboard shows you data across usage and sentiment to give you a fuller view of your organization's experience with Microsoft 365.
Experience insights is optimized for organizations with 2,000 or more licenses. Microsoft is working on bringing the experience to smaller organizations in the future. This information and data on the dashboard helps you better understand and improve your users' experience with Microsoft 365. The dashboard shows you data across usage and user sentiment and helps give you a fuller picture of your users' overall experience. You can drill down into specific information such as feature usage for certain apps, exact feedback and Net Promoter Score (NPS) comments, and top help articles viewed by users in your organization. This info can help you identify opportunities to improve users' Microsoft 365 products and app experiences in your organization.
Watch: Experience insights dashboard overview
Go to the Experience insights dashboard
From the Microsoft 365 admin center, you can access it at any time by selecting Experience insights (preview) from the admin home page.
If you're a member of the Reports Reader role, once you sign into the admin center, the Experience insights (preview) dashboard page is displayed. You can switch back to the admin center Dashboard view by selecting the dropdown option next to Experience insights (preview).
For more information, see About admin roles and Assign admin roles.
Overview
The Overview page shows you the following information in your organization:
- Data and information on feedback.
- Help article views.
Suggested training
Suggested training gives you deeper insights into the Microsoft 365 help and training articles that signed-in users read in the following places:
- support.microsoft.com.
- In-app help panels.
Suggested training gives you the following three insights:
Top viewed articles: Shows you help and training articles that people in your organization view the most.
Trending across organizations: Shows you the help and training articles that are moving up the most in your organization's most viewed list.
Commonly viewed together: Gives you insights into the additional help articles users in all Microsoft 365 organizations are reading, along with the top viewed and top trending articles. Use this info to put together and share training packages for your users.
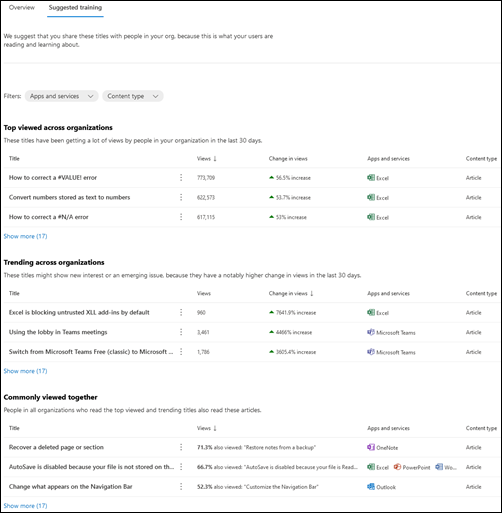
Use this data to decide which help articles and training resources to share with your users about the products and apps. You can also make sure your helpdesk is aware of these areas so they can answer any user questions. If your organization doesn't have enough views on help and training articles, data from other Microsoft 365 organizations is displayed.
Apps and services data
The Apps and services data section shows you a unified view across usage and sentiment in your organization to give you an at-a-glance understanding of your users' experience with Microsoft 365. Select an app or service to get additional details, such as:
- Comments submitted through feedback and NPS surveys.
- The top Microsoft 365 help articles your users viewed.
You can also favorite the apps or services in the list so that you can more easily view them.
Apps and services chart information
The chart information gives you insight into the apps and services that you want to track data on. Select an app or service to dig deeper into usage, product feedback, net promoter score, and help content data.
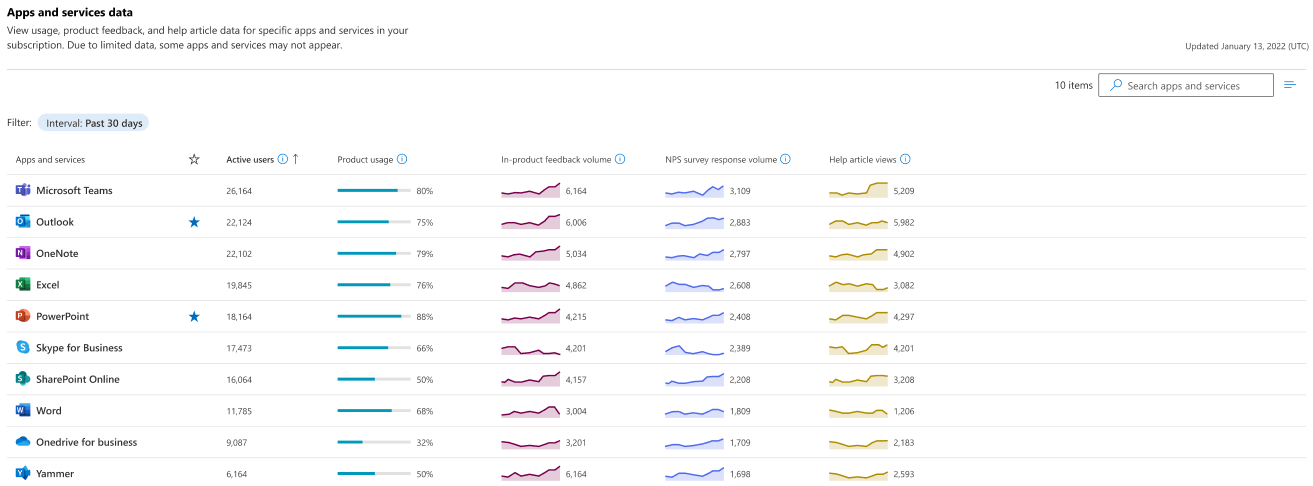
Active users shows the total count of unique users who perform at least one intentional action, like opening a file, in the app over the selected time period. Use this data to make sure you're hitting your adoption goals. Learn more.
Product usage is the percentage of people who actively use the products that are enabled for them. Use this data to make decisions on where to optimize product assignments.
In-product feedback is the total number of feedback responses from within the app or service that your users initiate and submit. Use this data to gauge the success and satisfaction people have with the apps. Learn more.
NPS survey response volume is the total number of responses to the Net Promoter Score (NPS) survey. By default, Microsoft sends the survey to 5% of your users and asks "Would you recommend this product?" Use this data to gauge user satisfaction and to see what people are saying about the app.
Help article views is the total number of views of Microsoft help articles and training videos about the app. Use this data to find articles of interest and share the suggested training with your users. Learn more.
Note
You can filter the chart data for trends over the last 30 days, 90 days, or 180 days.
Products and services data
Select a product or service to see more detailed information about product usage, user feedback, Net Promoter Score (NPS), and what help articles your users are reading.
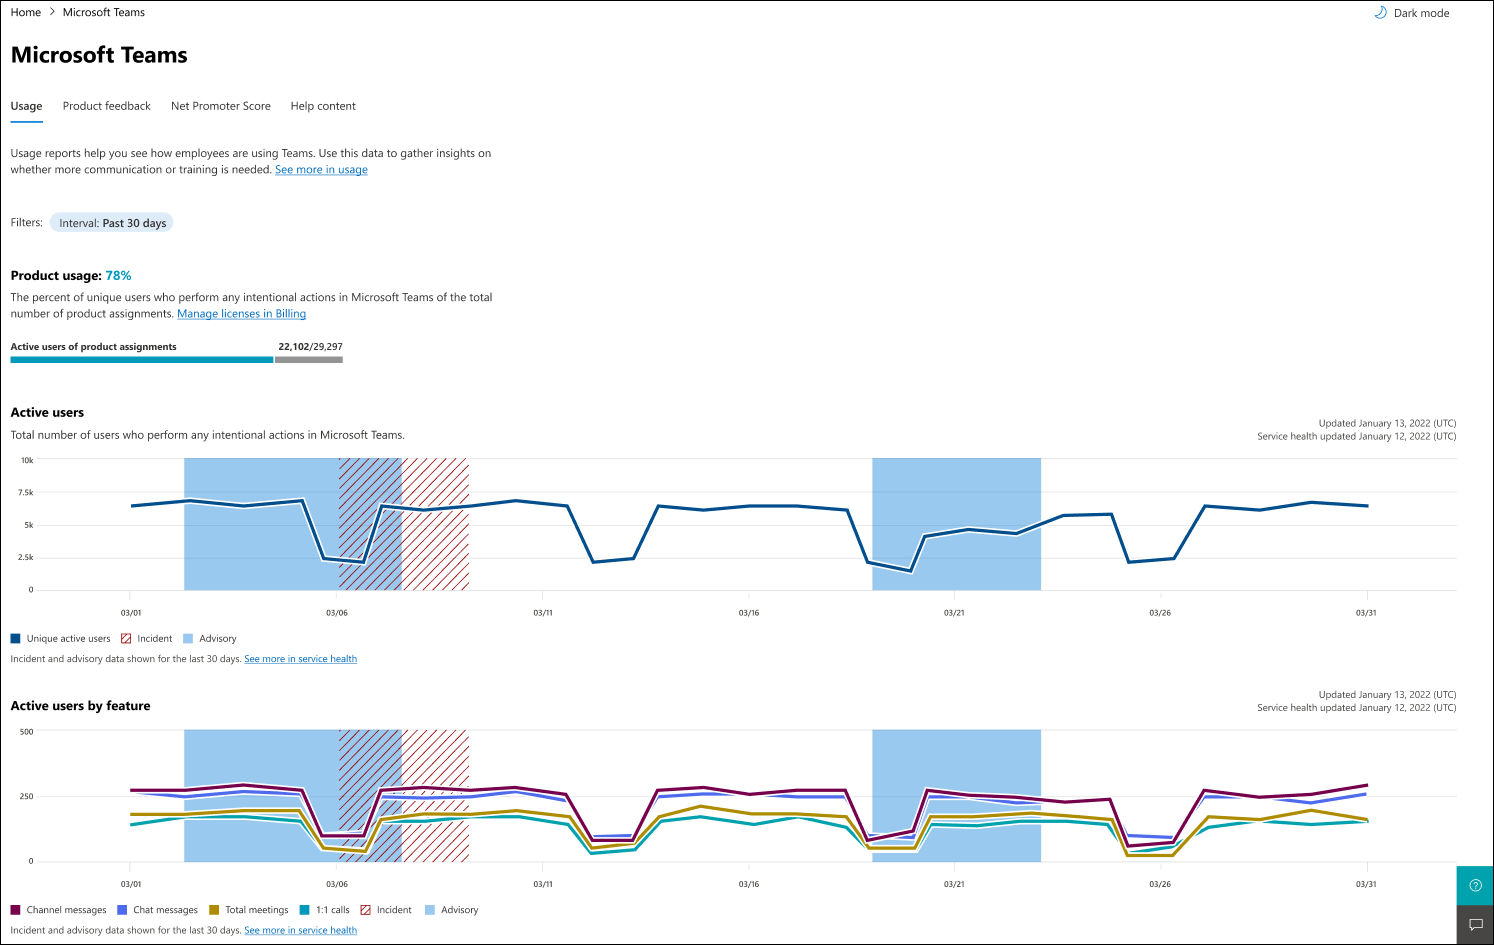
Microsoft Teams usage example
For some apps and services, you can see additional information about the usage of specific features to get a better understanding of what your users are using the most.
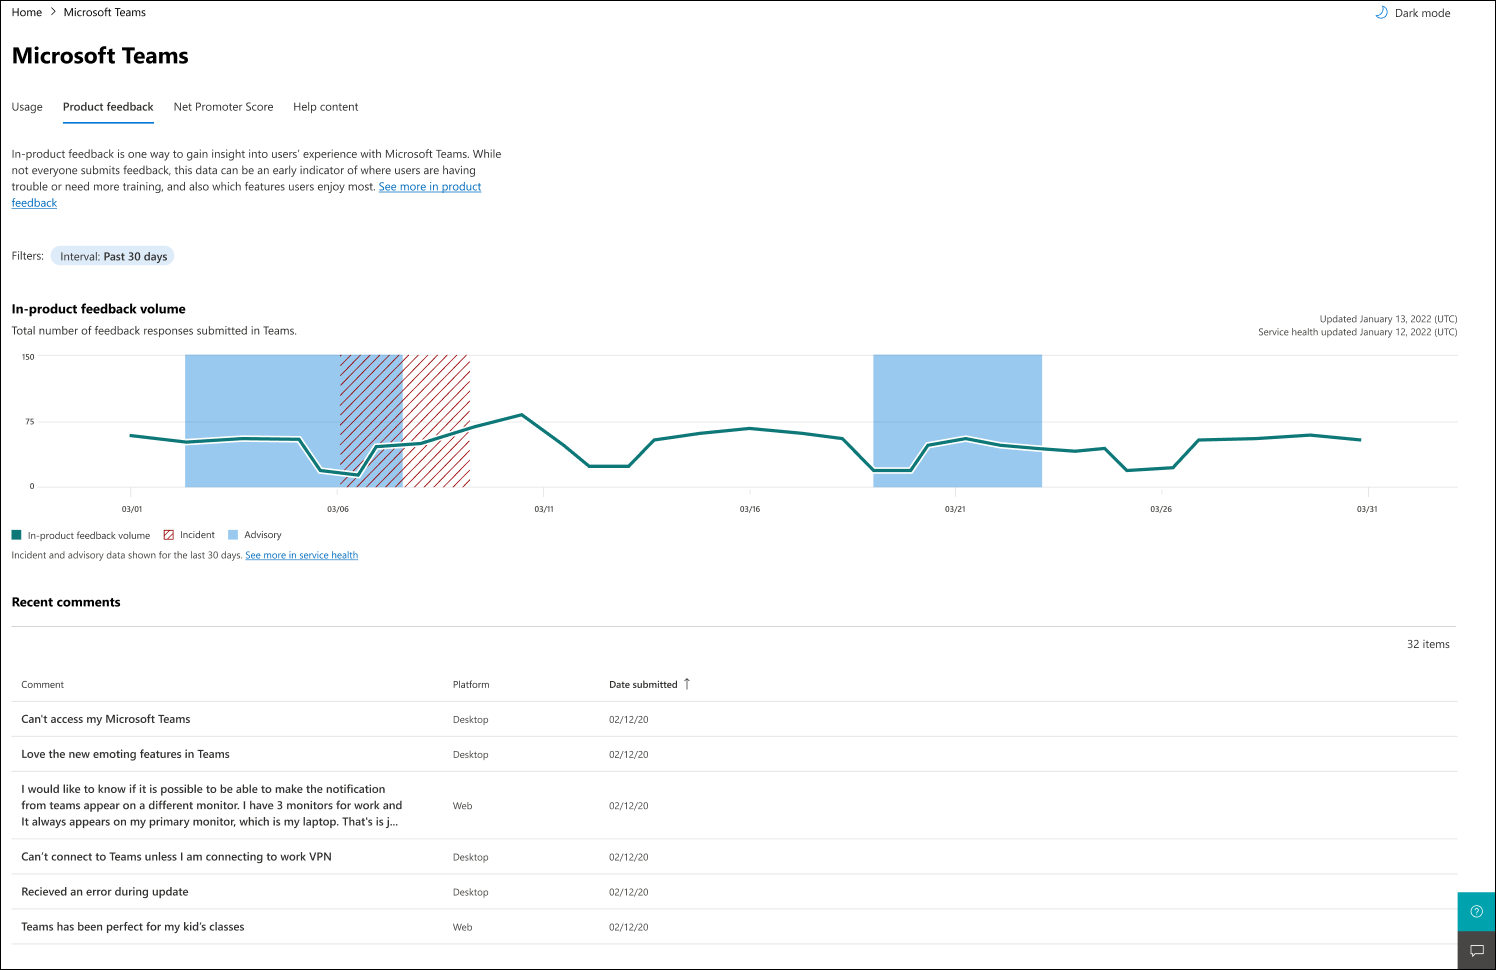
Teams user feedback example
In the user feedback section, you can see the actual comments your users submitted. This feedback helps you gauge if there's a pattern that needs to be addressed.
Teams Net Promoter Score (NPS) example
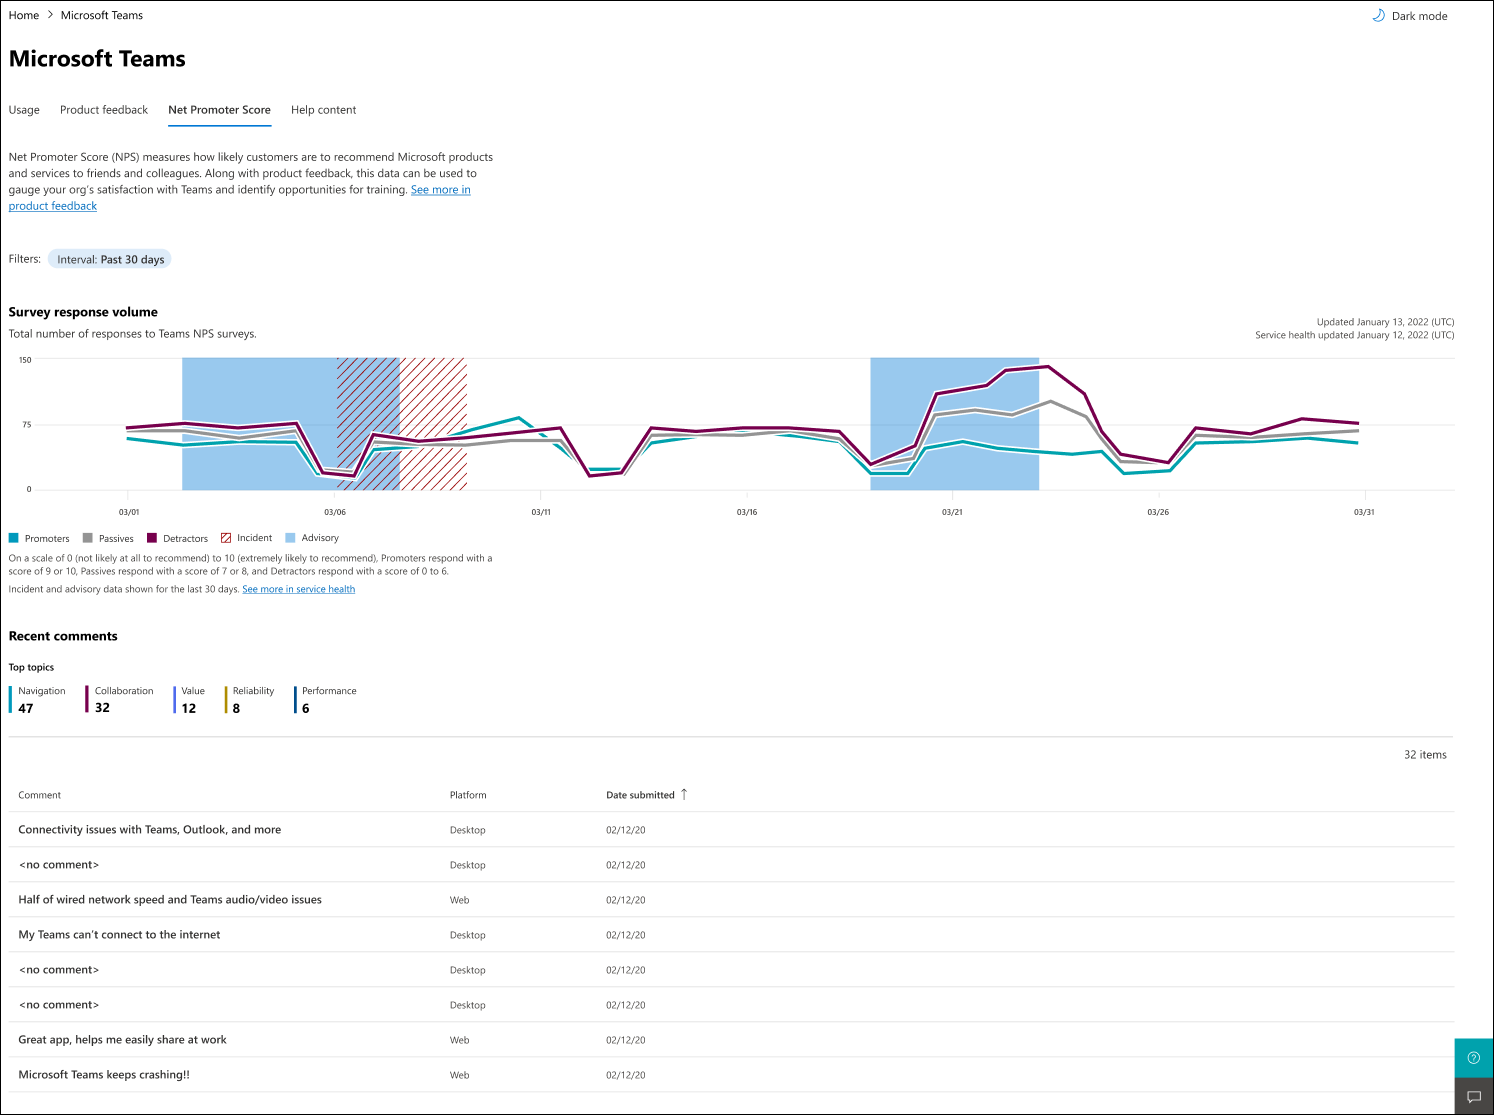
NPS details shows you promoters, passives, and detractors so that you can get a pulse on the sentiment in your organization. Similar to product feedback, you can also view the specific comments your users submitted. In some cases where there's enough volume, you might also see top articles that categorize some of the comments into bucketed categories for easier parsing of the data.
Microsoft Teams help article example
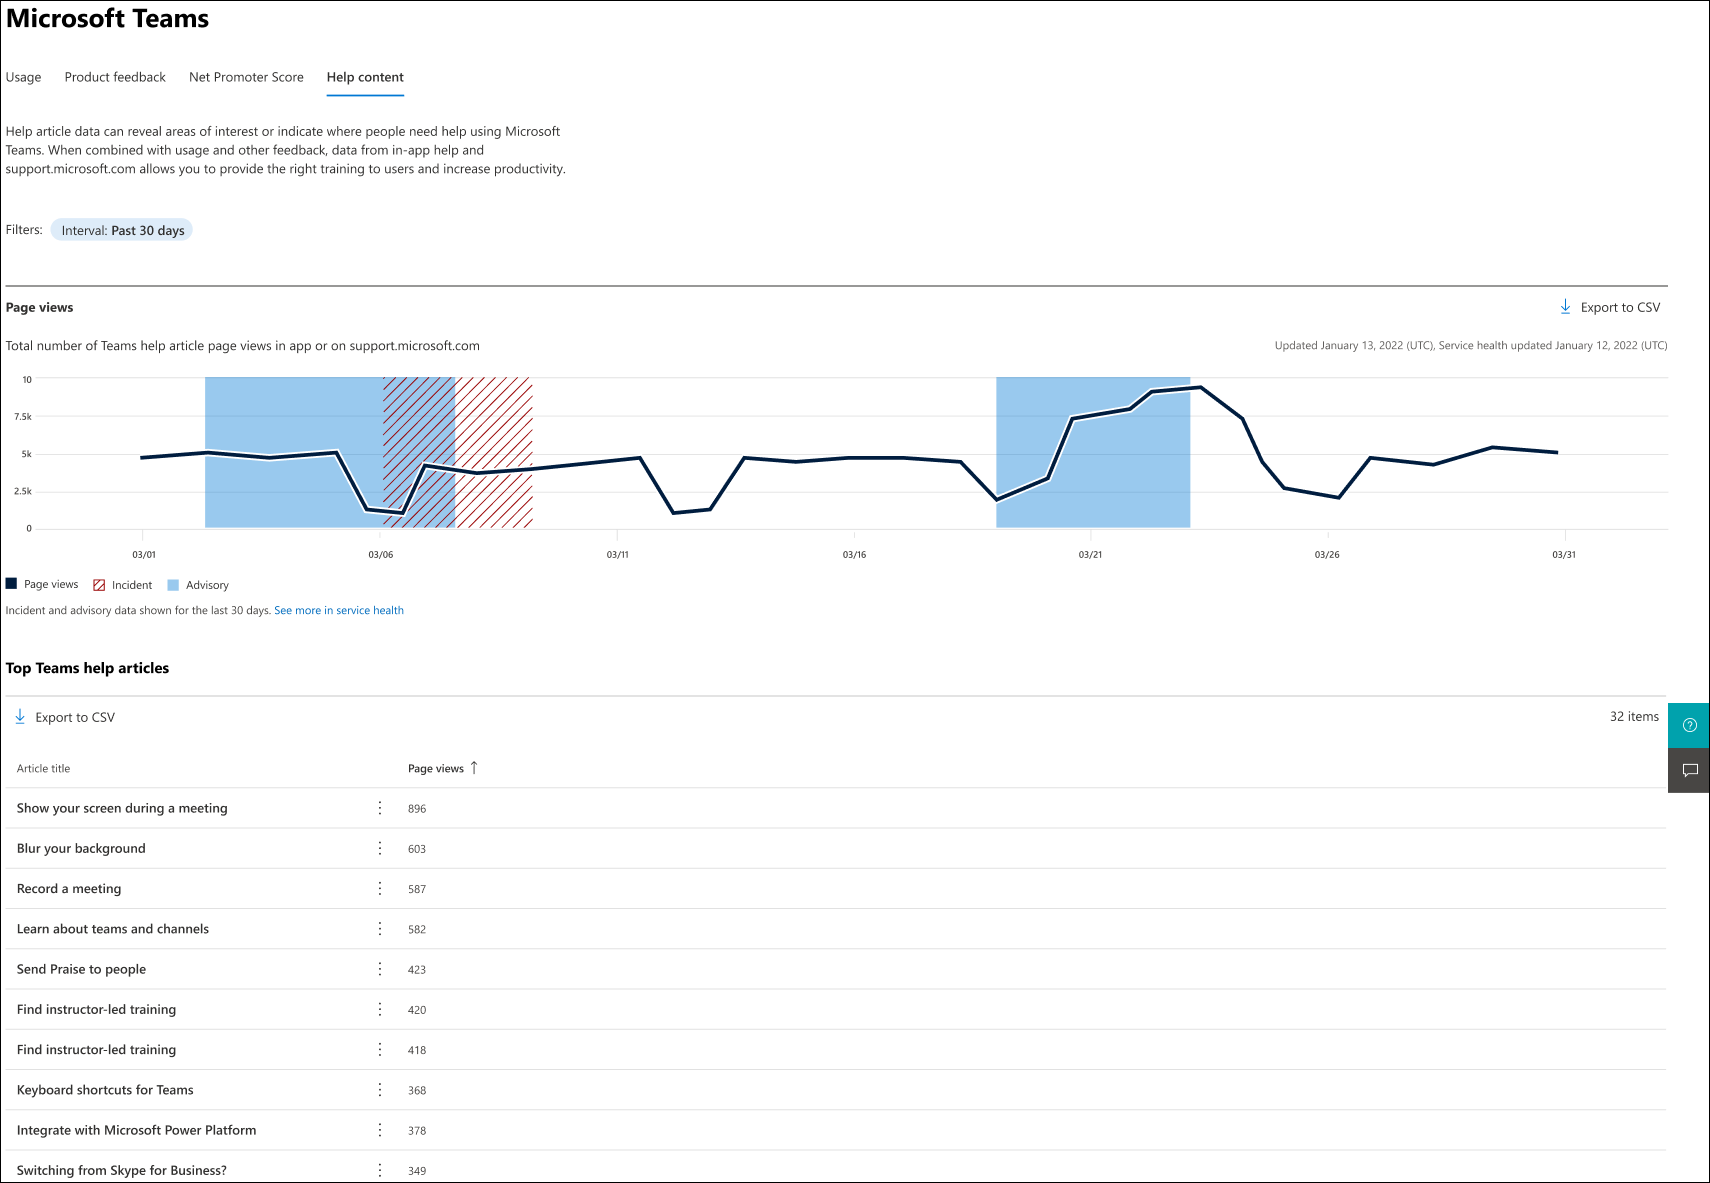
You can see what articles your users are consuming on support.microsoft.com or via the Microsoft 365 in-app help experiences. You can see the top articles for the specific app or service in your organization, how many people are viewing the app, and preview the article in-line. This information can be an excellent way of identifying what your users are trying to do and where they might be struggling. Since not all users seek out help, it's a good indication of content that might be beneficial to a broader set of users in the organization. Learn more
Interpret your organization's help article views
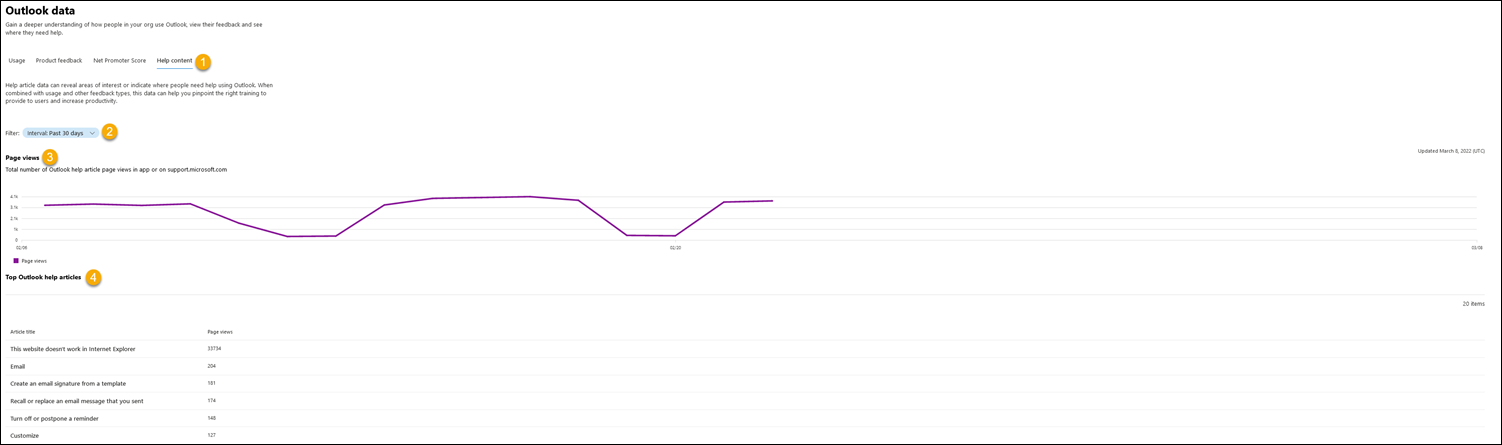
Chart information gives you insight into the apps and services that you want to track data. Help article views is the total number of help article page views that users in your organization viewed in a Microsoft 365 app or on support.microsoft.com.
Note
Help article views only show for users who sign in to the desktop app or sign in to support.microsoft.com.
| Item | Description |
|---|---|
| 1 | Use the Help content tab to identify where users need help with the app or service. |
| 2 | You can filter for trends over the last 30 days, 90 days, or 180 days. |
| 3 | Total number of help article page views in app or on support.microsoft.com. |
| 4 | List of the top help articles related to the app or service that your end-users are reading. If an article covers multiple apps, the article is shown for each related app. |
Examples of help articles
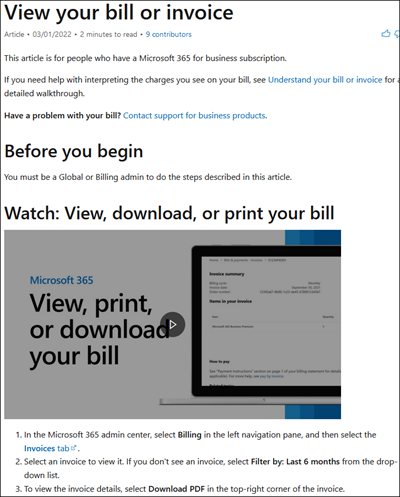
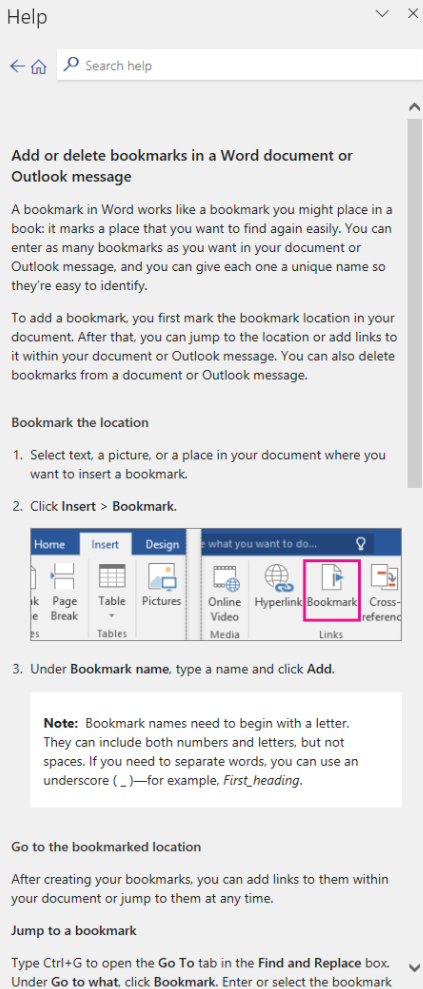
You can find help articles in-app in the help pane or at the Microsoft support page.
Help article on Microsoft support page
In-app help article in Microsoft Word
Manage adoption success with actions in Experience insights
Use actions to track the steps you take to drive user engagement and success for Microsoft 365 in your organization. Measure the impact of your actions by analyzing how each action correlates with changes in usage, NPS, feedback, and help article views. This information empowers you to make data-driven decisions and continuously improve your strategies for user engagement and satisfaction.
The actions experience within Microsoft 365 admin center includes the following features and capabilities:
- Add an action.
- Import multiple actions from a CSV file.
- Edit and remove previously added actions.
- Duplicate actions.
- Export the list of actions to CSV.
- View your action impact on Experience insights graphs.
- See the list of actions related to a product on the product detail card.
Get started
To manage actions, open the Experience Insights dashboard in the Microsoft 365 admin center, and then select the Actions tab. Familiarize yourself with two key experiences within the actions experience:
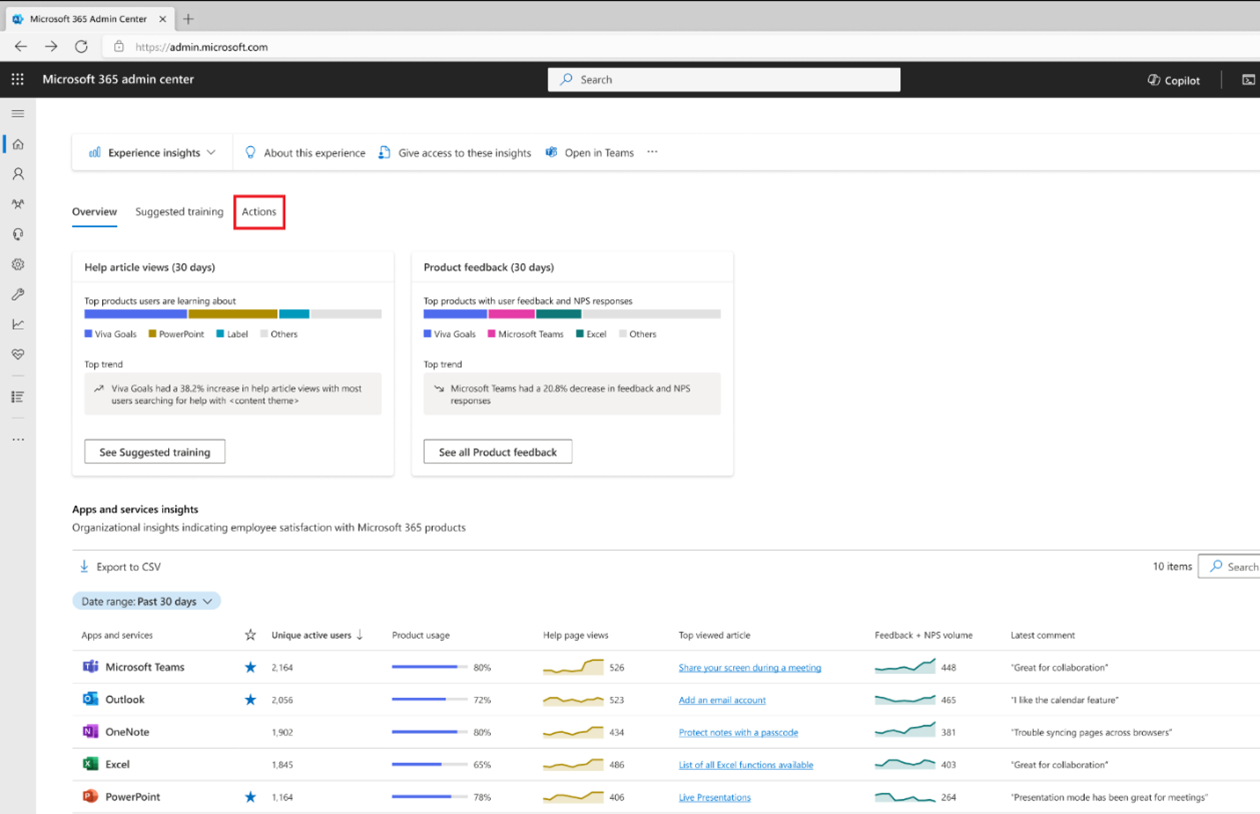
Add new actions
Select Add action.
Complete the form with the following details:
Title: Provide a distinct and descriptive title to help identify the action.
Date of action: Enter the date when you took the action.
Action type: Select the type of action.
Notes: Optional field to add in further description of your action.
Target products: Select one or more products associated with the action.
When you enter all required details, select Save.
You can also import multiple actions from a CSV file. Select Import from CSV and follow the instructions for editing and uploading the file. There's even a sample, pre-formatted CSV file that you can use to get started.
View action impact
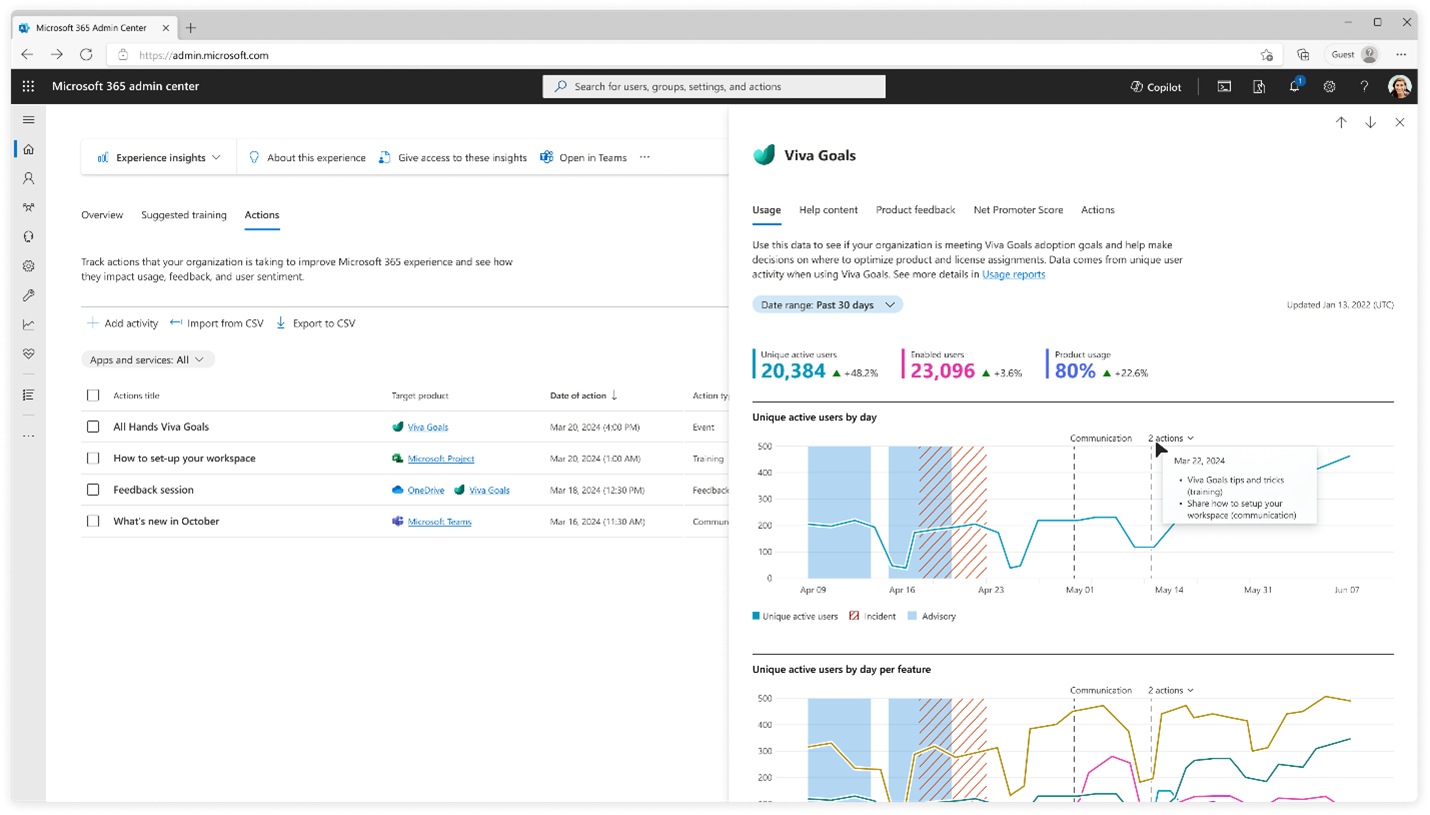
After you add an action, you can view it in the graphs in Experience insights. This view makes it easy to analyze how specific actions influence the data.
From the Actions list, select the Target product for an action to open its product detail card.
Select the Usage, Help Content, Product feedback, or Net Promoter Score tab.
On the date of the action, a vertical dashed line tracks the action against the graph's data.
Note
You might need to change the Date range to see the action.
When you select the Title of the action above the vertical dashed line, you see more details about the action.
Related content
View your organization's Adoption Score
Adoption Score supports the journey to digital transformation with insights about how your organization uses Microsoft 365 and the technology experiences that support it. Your organization's score reflects people and technology experience measurements and can be compared to benchmarks from organizations similar in size to yours. For more information on Adoption Score, see Adoption Score.
Take training for adoption specialists
This introductory course explains the six critical elements to drive adoption of your Microsoft cloud services to deliver value to your company. This course is applicable to any size company and uses Microsoft 365 and Teams as the example service to create real-world scenarios. For more information about training for adoption specialists, see Use the Microsoft service adoption framework to drive adoption in your enterprise.
Join the adoption community
Welcome to the Driving Adoption Community! Connect and discuss the latest articles and best practices in driving cloud adoption. Meet and learn from peers and Microsoft staff, and stay up to date on upcoming training, events, and our monthly community calls. For more information, see Driving Adoption.
Use the Microsoft 365 adoption tools
Use our resources to go from inspiration to execution with our productivity cloud. Get started, experiment with our services, and onboard users at scale while being confident that you're improving the user experience. For more information, see Drive value with Microsoft 365 adoption tools.