Bilješka
Pristup ovoj stranici zahtijeva provjeru vjerodostojnosti. Možete pokušati da se prijavite ili promijenite direktorije.
Pristup ovoj stranici zahtijeva provjeru vjerodostojnosti. Možete pokušati promijeniti direktorije.
Application Insights Profiler for .NET captures performance traces that identify the slow code paths in your running application. When the Profiler doesn't start, traces don't show up, requests time out, or a configuration or hosting problem gets in the way, you lose that visibility into where your app spends its time.
This article walks you through the checks that get the Profiler working again, including verifying endpoints, supported .NET runtimes, service plans, network connectivity, and service-specific diagnostics.
Are you using the appropriate .NET Profiler endpoint?
Currently, only Azure Government and Microsoft Azure operated by 21Vianet require endpoint modifications.
| App setting | US Government Cloud | China Cloud |
|---|---|---|
ApplicationInsightsProfilerEndpoint |
https://profiler.monitor.azure.us |
https://profiler.monitor.azure.cn |
ApplicationInsightsEndpoint |
https://dc.applicationinsights.us |
https://dc.applicationinsights.azure.cn |
Is your app running on a supported .NET version?
The Profiler supports .NET Framework 4.6.2 or later.
If your web app is an ASP.NET Core application, it must run on the latest supported ASP.NET Core runtime.
Are you using a supported Azure service plan?
Profiler for .NET isn't currently supported on free or shared App Service plans. Upgrade to one of the basic plans for Profiler to start working.
Note
The Azure Functions consumption plan isn't supported. See Enable the .NET Profiler for Azure Functions apps.
Are you searching for .NET Profiler data within the right time frame?
If the data you're trying to view is older than 15 days, try limiting your time filter and try again. Traces are deleted after 15 days.
Are you aware of the .NET Profiler sampling rate and overhead?
The .NET Profiler randomly runs two minutes per hour on each virtual machine (VM) hosting applications with Profiler enabled.
Note
When the Application Insights Profiler for .NET is actively running and collecting traces, it typically adds between 5% to 15% of CPU and memory overhead to your server.
There is no additional cost for storing data captured by .NET Profiler. The data is automatically deleted after 15 days.
Can you access the .NET Profiler gateway?
Check that a firewall or proxies aren't blocking access to the Application Insights Profiler gateway at https://gateway.azureserviceprofiler.net.
Are you seeing timeouts or do you need to check if the .NET Profiler is running?
The Profiler uploads profiling data only when it can attach the data to a request that happens while the Profiler is running. The .NET Profiler collects data for two minutes each hour. You can also trigger the Profiler by starting a profiling session.
The Profiler writes trace messages and custom events to your Application Insights resource. You can use these events to see how the Profiler is running.
Search for trace messages and custom events that the .NET Profiler sends to your Application Insights resource.
In your Application Insights resource, select Search from the top menu.

Use the following search string to find the relevant data:
stopprofiler OR startprofiler OR upload OR ServiceProfilerSample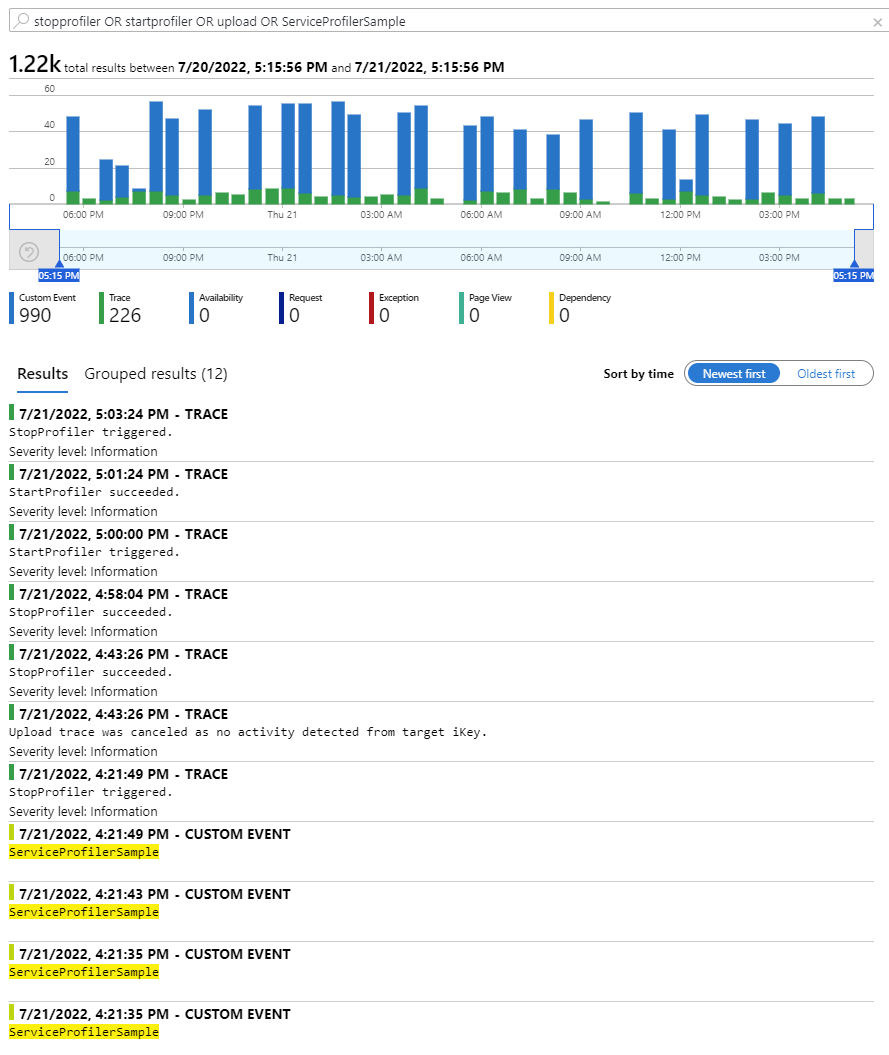
The preceding search results include two examples of searches from two Application Insights resources:
If the application isn't receiving requests while the Profiler is running, the message explains that the Profiler canceled the upload because of no activity.
The Profiler starts and sends custom events when it detects requests that happen while the Profiler is running. If the
ServiceProfilerSamplecustom event appears, it means that the Profiler captured a profile, which is available on the Application Insights Performance page.
If no records appear, the Profiler isn't running or took too long to respond. Make sure Profiler is enabled on your Azure service.
The .NET Profiler is on, but it didn't capture any traces
Even if you enable the Profiler, it might not capture or upload traces. This behavior is common in the following situations:
No incoming requests to your application:
Manually invoke your application, or create an availability test or a load test.
No incoming telemetry acknowledged by Application Insights:
- If traffic is coming to your application: validate that Application Insights Live Metrics shows incoming requests.
- If the
Incoming Requestscharts are empty (no data or showing zero): troubleshoot Application Insights. - If you host your .NET application on Azure App Service, see Troubleshoot Application Insights integration with Azure App Service.
Profiler setting for Sampling is turned off:
If no profiler traces are available, check the Profiler Sampling setting.
- Open Application Insights > Performance.
- Select Profiler.
- Select the Triggers button.
- In the Trigger Settings, make sure Sampling is on.
Still no traces uploaded?
Create a support request, ask Azure community support, or submit product feedback to the Azure feedback community.
Double counting in parallel threads
When two or more parallel threads associate with a request, the stack viewer's total time metric might exceed the request's duration. In this case, the total thread time surpasses the actual elapsed time.
For example, one thread might wait for the other thread to finish. The viewer tries to detect this situation and omits the uninteresting wait. In doing so, it errs on the side of displaying too much information rather than omitting what might be critical information.
When you see parallel threads in your traces, determine which threads are waiting so that you can identify the hot path for the request. Usually, the thread that quickly goes into a wait state waits on the other threads. Concentrate on the other threads and ignore the time in the waiting threads.
Azure App Service
For the .NET Profiler to work properly, ensure that you:
Enable Application Insights for your web app with the right settings.
Run the ApplicationInsightsProfiler3 WebJob. To check the WebJob:
Go to Kudu. In the Azure portal:
In your App Service instance, select Advanced Tools in the left pane.
Select Go.
On the top menu, select Tools > WebJobs dashboard. The WebJobs pane opens.
If ApplicationInsightsProfiler3 doesn't show up, restart your App Service application.
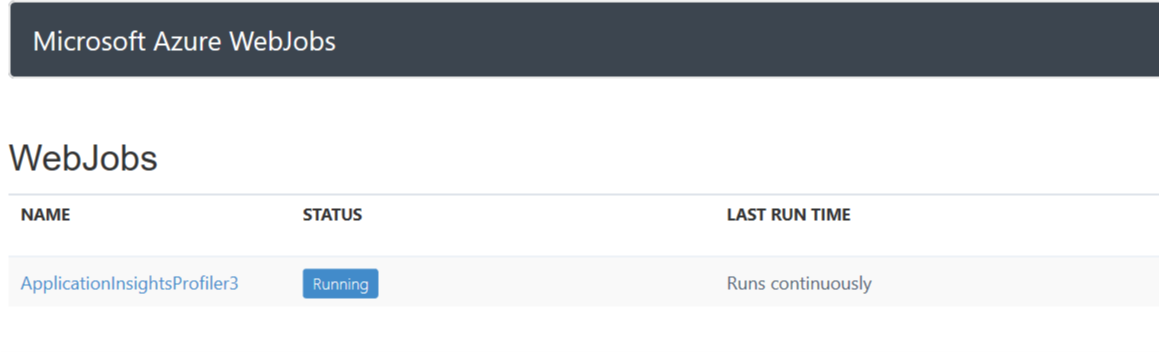
To view the details of the WebJob, including the log, select the ApplicationInsightsProfiler3 link. The Continuous WebJob Details pane opens.
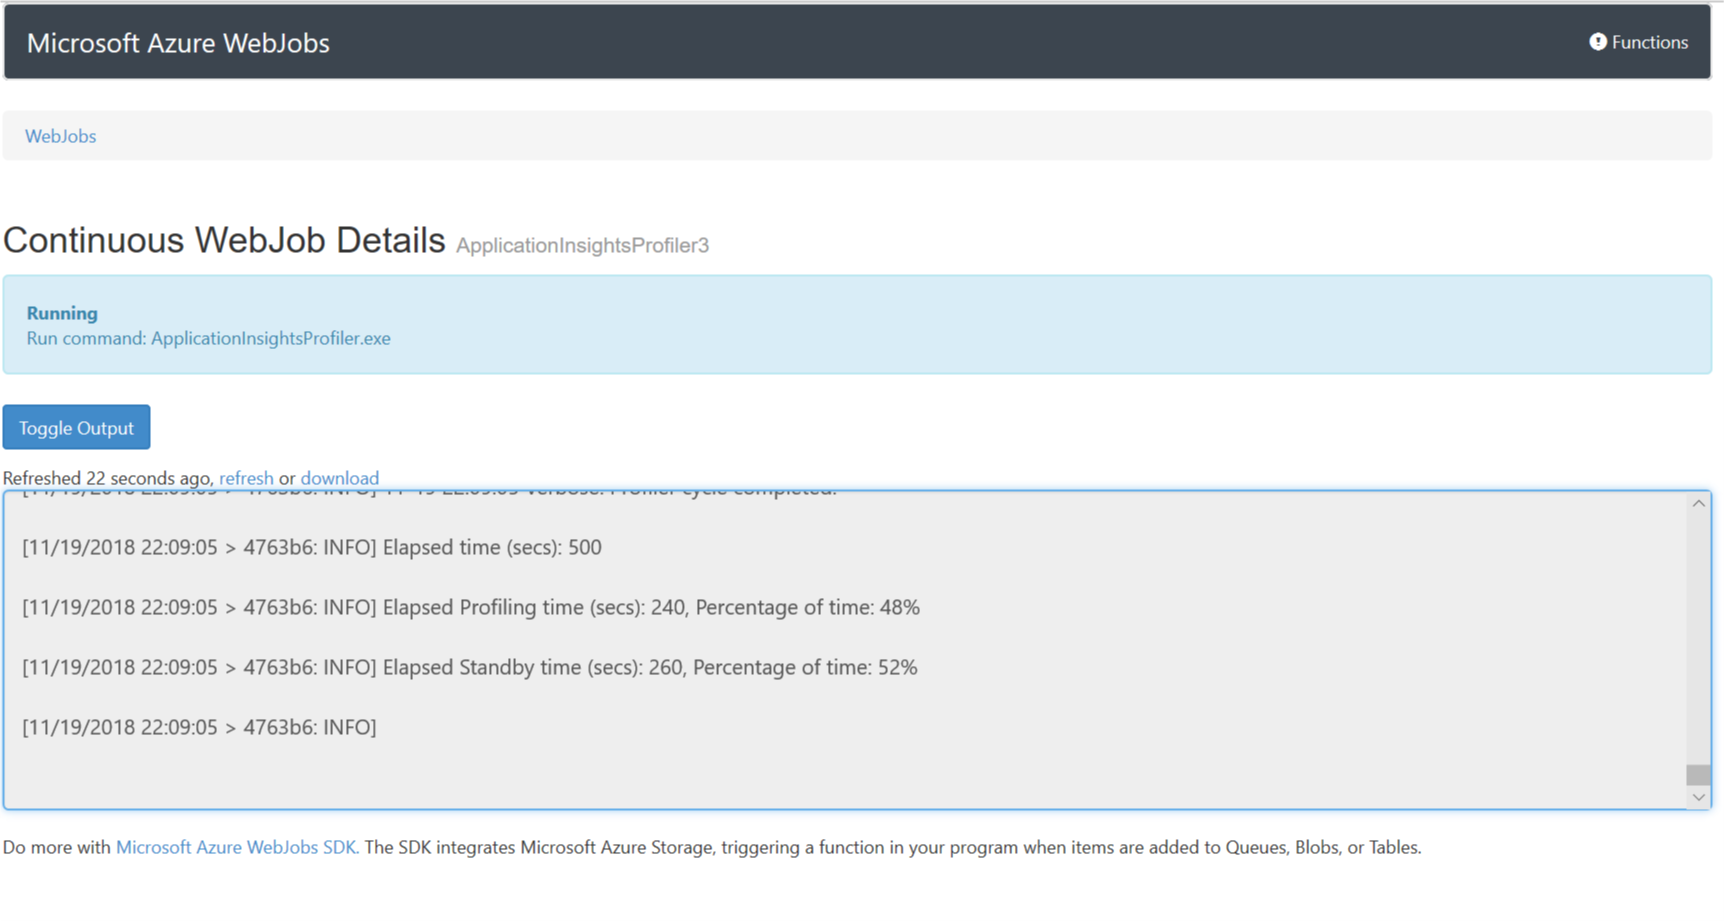
If the .NET Profiler still isn't working, download the log and submit an Azure support ticket.
Check the Diagnostic Services site extension status page
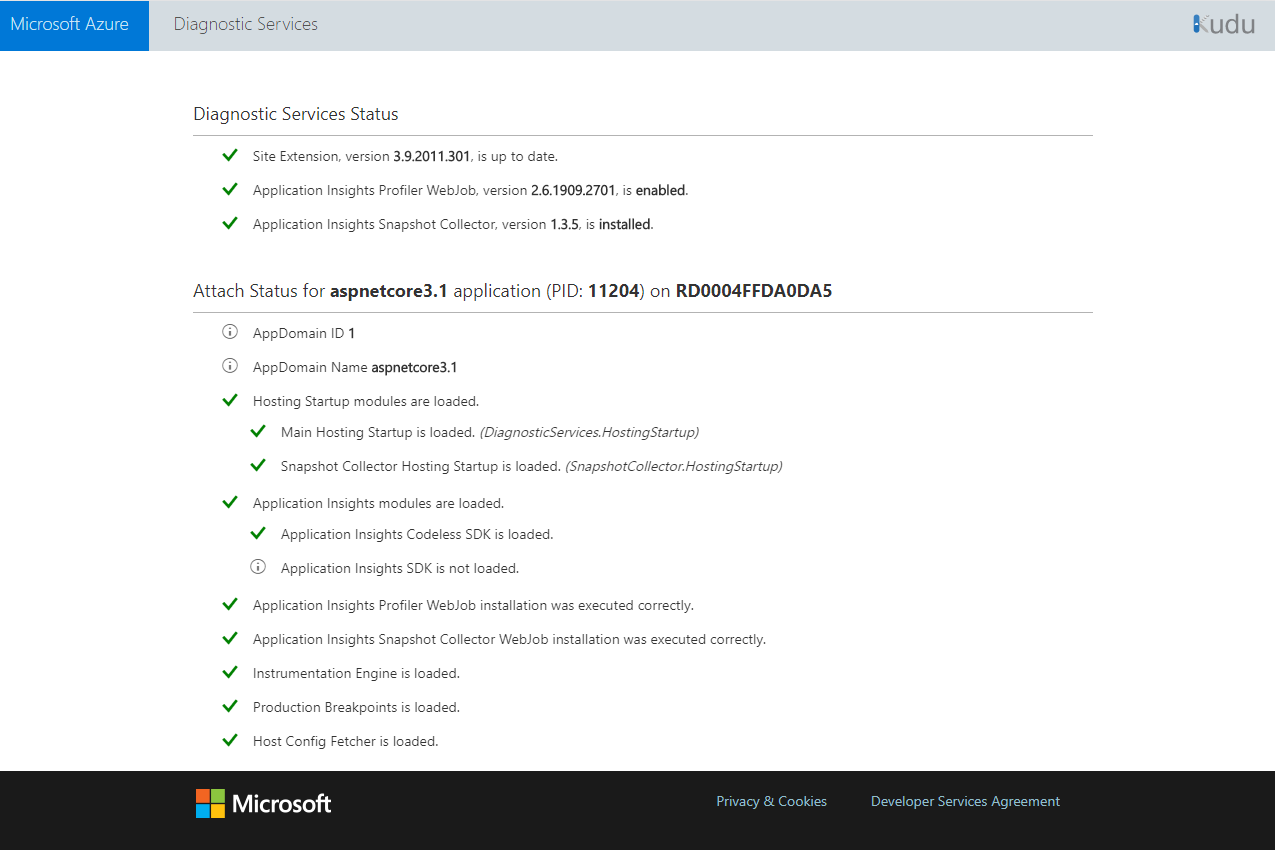
If you enable the .NET Profiler through the Application Insights page in the Azure portal, the Diagnostic Services site extension manages it. The status page for this extension shows the installation state of the .NET Profiler and Snapshot Debugger agents. If there's an unexpected error, it appears along with steps to fix it.
To open the status page, use the Kudu management site for App Service to get its base URL:
- Open your App Service application in the Azure portal.
- Select Advanced Tools.
- Select Go.
- On the Kudu management site, append
/DiagnosticServicesto the URL and select Enter.
The status page URL ends like https://<kudu-url>/DiagnosticServices.
Note
The domain of the status page link varies depending on the cloud. This domain is the same as the Kudu management site for App Service.
A status page appears similar to the following example.
Note
Codeless installation of Application Insights Profiler for .NET follows the .NET Core support policy. For more information about supported runtimes, see .NET Core support policy.
Manually install the .NET Profiler on Azure App Service
When you configure the .NET Profiler, the process updates the web app's settings. If necessary, you can apply the updates manually.
Too many active profiling sessions
In Azure App Service, you can have only one profiling session at a time per VM. Azure App Service enforces this limit at the VM level across all applications and deployment slots running in an App Service plan. This limit applies equally to profiling sessions you start through Diagnose and solve problems, Kudu, and Application Insights Profiler for .NET.
For a single app scaled out to multiple instances, each instance runs on a separate VM and can run its own profiling session independently. The contention occurs only when multiple apps or deployment slots on the same App Service plan share the same VM.
If the .NET Profiler tries to start a session when another session is already running on the same VM, it logs an error in the Application Log and the continuous WebJob log for ApplicationInsightsProfiler3.
You might see one of the following messages in the logs:
Microsoft.ServiceProfiler.Exceptions.TooManyETWSessionExceptionError: StartProfiler failed. Details: System.Runtime.InteropServices.COMException (0xE111005E): Exception from HRESULT: 0xE111005E
The error code 0xE111005E indicates that a profiling session couldn't start because another session is already running.
To avoid the error and reduce noise in your deployment logs:
- Move some web apps to a different App Service plan so they don't share VMs.
- Disable the Profiler on applications that don't need profiling.
- Stop any unused deployment slots. Each running slot has the Profiler active and competes for the profiling session on its VM.
- During deployments, consider temporarily disabling the Profiler on staging slots to prevent errors caused by slot swaps triggering concurrent sessions.
Deployment error: Directory Not Empty 'D:\home\site\wwwroot\App_Data\jobs'
If you redeploy your web app to a Web Apps resource with the .NET Profiler enabled, you might see the following message:
Directory Not Empty 'D:\home\site\wwwroot\App_Data\jobs'
This error occurs if you run Web Deploy from scripts or from Azure Pipelines. Resolve it by adding the following deployment parameters to the Web Deploy task:
-skip:Directory='.*\\App_Data\\jobs\\continuous\\ApplicationInsightsProfiler.*' -skip:skipAction=Delete,objectname='dirPath',absolutepath='.*\\App_Data\\jobs\\continuous$' -skip:skipAction=Delete,objectname='dirPath',absolutepath='.*\\App_Data\\jobs$' -skip:skipAction=Delete,objectname='dirPath',absolutepath='.*\\App_Data$'
These parameters prevent Web Deploy from deleting the directories that Application Insights Profiler for .NET uses and unblock the redeploy process. They don't affect the Profiler instance that's currently running.
The command adds four skip rules so that Web Deploy leaves the running Profiler WebJob in place:
- Skip the
App_Data\jobs\continuous\ApplicationInsightsProfiler*directory. - Skip deletion of the
App_Data\jobs\continuousdirectory. - Skip deletion of the
App_Data\jobsdirectory. - Skip deletion of the
App_Datadirectory.
Is Application Insights Profiler for .NET running?
The Profiler runs as a continuous WebJob named ApplicationInsightsProfiler3 in the web app. To check its status and view its logs, see the Azure App Service section.
Troubleshoot the .NET Profiler on Azure virtual machines
To check whether Azure Diagnostics configures the .NET Profiler correctly:
- Verify that the deployed Azure Diagnostics configuration matches your expectations.
- Ensure Azure Diagnostics passes the correct connection string on the Profiler command line.
- Review the Profiler log file to see whether the .NET Profiler ran but returned an error.
To check the settings that configure Azure Diagnostics:
Sign in to the virtual machine.
Open the log file at this location. The plug-in version might be newer on your machine.
c:\WindowsAzure\logs\Plugins\Microsoft.Azure.Diagnostics.PaaSDiagnostics\1.11.3.12\DiagnosticsPlugin.logSearch the file for the string
WadCfgto find the settings that Azure Diagnostics passes to the virtual machine to configure Azure Diagnostics.Verify that the connection string that the .NET Profiler sink uses is correct.
Check the command line that starts Profiler. The command line arguments are in the following file (the drive could be
c:ord:and the directory might be hidden):C:\ProgramData\ApplicationInsightsProfiler\config.jsonEnsure that the connection string on the Profiler command line is correct.
By using the path in the preceding
config.jsonfile, check the Profiler log file, calledBootstrapN.log. It shows:- The debug information that indicates the settings that Profiler uses.
- Status and error messages from Profiler.
Find the file:
C:\WindowsAzure\Logs\Plugins\Microsoft.Azure.Diagnostics.IaaSDiagnostics\1.17.0.6\ApplicationInsightsProfilerIf the .NET Profiler is running while your application is receiving requests, it logs the following message to confirm it detected activity for the resource that your connection string identifies. The log text uses the legacy
iKeylabel:Activity detected from iKey.When Profiler uploads the trace, the following message appears:
Start to upload trace.
Edit network proxy or firewall rules
If your application connects to the internet by using a proxy or a firewall, you might need to update the rules to communicate with the .NET Profiler.
The Azure Monitor service tag includes the IP addresses that Application Insights Profiler for .NET uses. For more information, see Azure service tags overview.
Troubleshoot "bring your own storage" (BYOS)
Troubleshoot common issues in configuring BYOS.
Scenario: Template schema '{schema_uri}' isn't supported
You received an error similar to the following example:
New-AzResourceGroupDeployment : 11:53:49 AM - Error: Code=InvalidTemplate; Message=Deployment template validation failed: 'Template schema
'https://schema.management.azure.com/schemas/2020-01-01/deploymentTemplate.json#' is not supported. Supported versions are
'2014-04-01-preview,2015-01-01,2018-05-01,2019-04-01,2019-08-01'. Please see https://aka.ms/arm-template for usage details.'.
Solutions
Make sure that the
$schemaproperty of the template is valid. It must follow this pattern:https://schema.management.azure.com/schemas/{schema_version}/deploymentTemplate.json#Make sure that the
schema_versionof the template is within valid values:2014-04-01-preview, 2015-01-01, 2018-05-01, 2019-04-01, 2019-08-01.
Scenario: No registered resource provider found for location '{location}'
You received an error similar to the following example:
New-AzResourceGroupDeployment : 6:18:03 PM - Resource microsoft.insights/components 'byos-test-westus2-ai' failed with message '{
  "error": {
    "code": "NoRegisteredProviderFound",
    "message": "No registered resource provider found for location 'westus2' and API version '2020-03-01-preview' for type 'components'. The supported api-versions are '2014-04-01,
2014-08-01, 2014-12-01-preview, 2015-05-01, 2018-05-01-preview'. The supported locations are ', eastus, southcentralus, northeurope, westeurope, southeastasia, westus2, uksouth,
canadacentral, centralindia, japaneast, australiaeast, koreacentral, francecentral, centralus, eastus2, eastasia, westus, southafricanorth, northcentralus, brazilsouth, switzerlandnorth,
australiasoutheast'."
  }
}'
Solutions
- Make sure that the
apiVersionof the resourcemicrosoft.insights/componentsis2015-05-01. - Make sure that the
apiVersionof the resourcelinkedStorageAccountis2020-03-01-preview.
Scenario: Storage account location should match Application Insights component location
You received an error similar to the following example:
New-AzResourceGroupDeployment : 1:01:12 PM - Resource microsoft.insights/components/linkedStorageAccounts 'byos-test-centralus-ai/serviceprofiler' failed with message '{
  "error": {
    "code": "BadRequest",
    "message": "Storage account location should match AI component location",
    "innererror": {
      "trace": [
        "System.ArgumentException"
      ]
    }
  }
}'
Solution
Make sure that the location of the Application Insights resource is the same as the storage account.
Get support for Application Insights Profiler for .NET
If you still need help with Application Insights Profiler for .NET, submit a support ticket by selecting the question mark icon in the Azure portal. Include the correlation ID from the error message.